
The Power Behind Modern Sales Performance Dashboards

Modern businesses thrive on data. For sales teams in the UK, having a clear view of performance is now mission-critical. A sales performance dashboard acts as a central hub, converting raw data into usable insights. This allows teams to make informed decisions, improve strategies, and ultimately increase revenue. We've come a long way from static spreadsheets to the dynamic, real-time systems of today.
From Spreadsheets to Strategic Advantage
Sales teams previously relied on cumbersome spreadsheets and manual reports. This often resulted in outdated information and a lack of visibility into key performance indicators (KPIs). Modern sales performance dashboards, however, offer a single source of truth. This source is accessible to everyone, from sales representatives to C-suite executives. This shared access promotes better alignment and communication, enabling data-driven decisions across the organization. For instance, a dashboard can instantly highlight top-performing products in specific regions. This information is invaluable for targeted marketing and effective inventory management.
Real-Time Insights for a Competitive Edge
In the fast-paced UK market, access to real-time data is essential. Modern dashboards allow teams to track key metrics as they change, spotting trends and potential issues early. This flexibility is vital for adapting to market changes and outmaneuvering competitors. Sales leaders can quickly see what's working and what needs adjusting, maximizing gains and minimizing losses. Real-time dashboards also allow for proactive management. Managers can coach team members, adjust targets, or fine-tune marketing campaigns based on live performance data.
In the first quarter of 2025, UK business sales performance underscored the need for real-time analytics. A survey of approximately 5,000 UK businesses painted a mixed picture. While 31% reported sales growth and 42% saw stable numbers, 27% experienced a decline. This highlights the volatile nature of the market and the crucial role of sales dashboards. Find more detailed statistics here. These tools give businesses the timely insights they need for effective decision-making. Having a clear, up-to-the-minute view of sales performance is now paramount for success. Sales performance dashboards empower businesses to navigate market changes effectively, capitalizing on opportunities and mitigating potential downturns. With a powerful dashboard, UK businesses can transform data into a true competitive advantage, driving sustainable growth in a dynamic market.
Essential Metrics That Drive Meaningful Results
A sales performance dashboard isn't just a collection of charts; it's a strategic tool that provides valuable insights into your sales operations. To maximize its potential, focus on the metrics that truly matter to your business. This involves understanding both lagging indicators, which reflect past performance, and leading indicators, which offer a glimpse into the future.
Lagging Indicators: Measuring Outcomes
Lagging indicators provide a snapshot of what's already happened. They're crucial for evaluating the effectiveness of past strategies and identifying areas for improvement.
-
Revenue: The total value of sales generated over a specific period. This is the ultimate bottom-line metric for any sales team.
-
Conversion Rates: The percentage of leads that convert into paying customers. This metric highlights the effectiveness of your sales funnel.
-
Customer Acquisition Cost (CAC): The average cost of acquiring a new customer. Keeping CAC low is essential for profitability.
-
Average Deal Size: The average value of each closed deal. Increasing this metric can significantly boost revenue.
Leading Indicators: Predicting Future Performance
Leading indicators help you anticipate future sales performance and make proactive adjustments. These metrics offer insights into the activities that drive future success.
-
Pipeline Velocity: The speed at which deals move through your sales pipeline. A faster velocity often suggests a more efficient sales process.
-
Engagement Scores: How actively prospects are interacting with your content or sales team. High engagement often correlates with higher conversion rates.
-
Lead Quality: The likelihood of a lead converting into a customer based on specific criteria. Focusing on high-quality leads improves efficiency and reduces CAC.
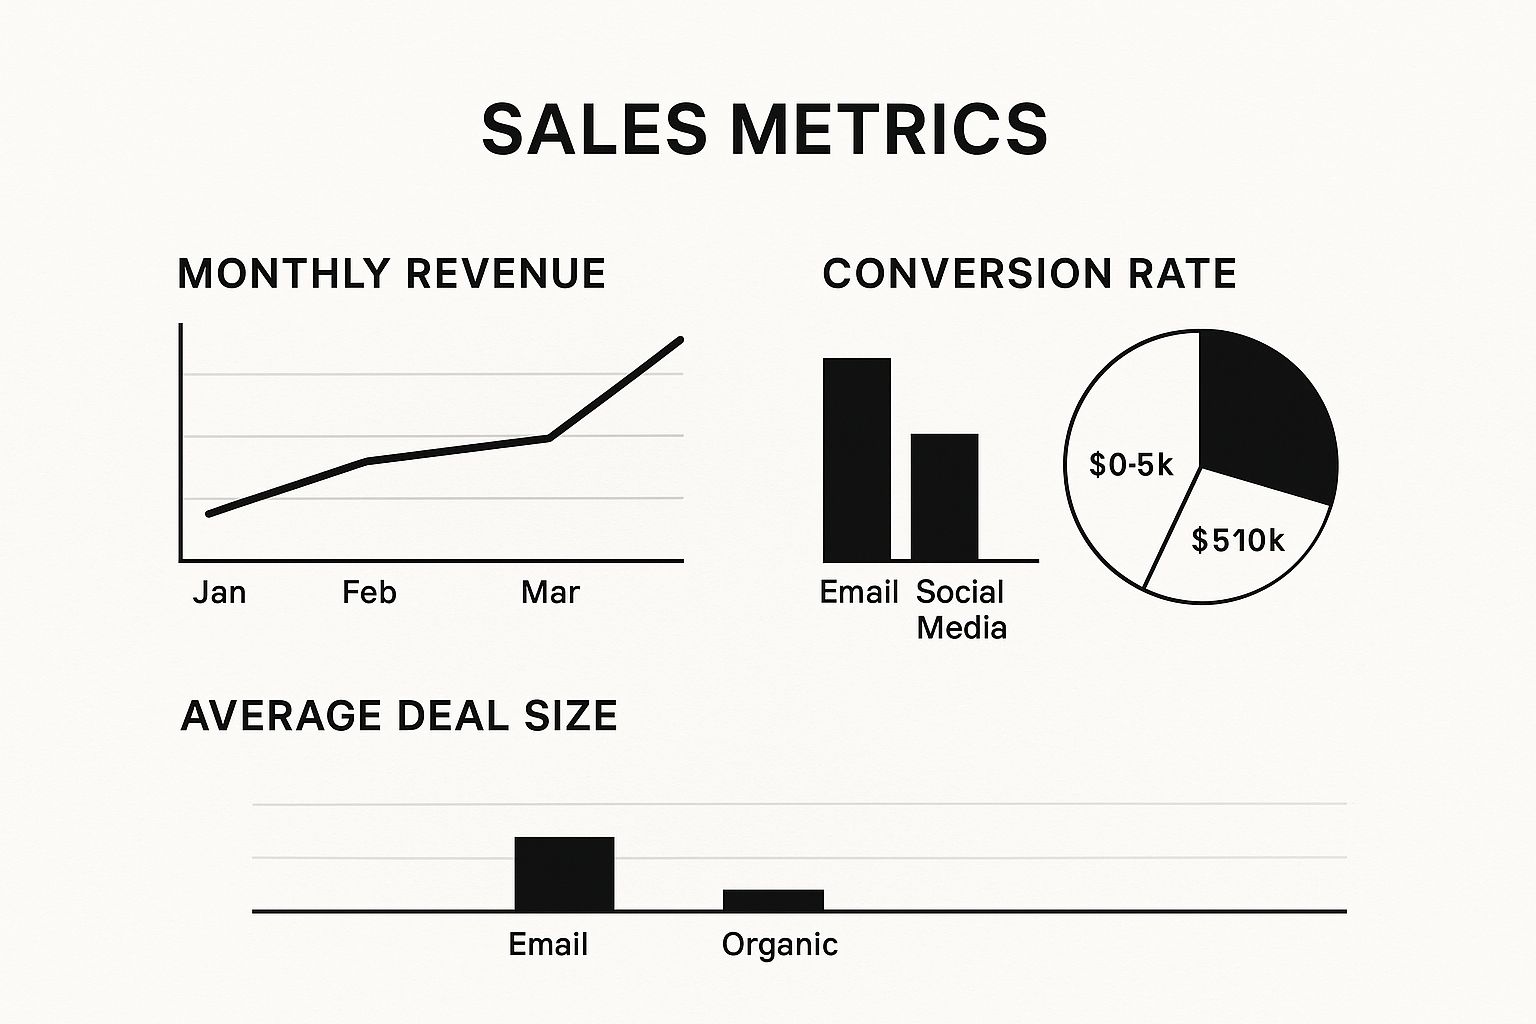
The infographic above visualizes monthly revenue trends, conversion rates across channels, and average deal size distribution. As shown, online channels are driving the highest conversion rates, while average deal size remains consistent across customer segments. To better understand your sales performance, a robust analytics dashboard like a Shopify Analytics Dashboard is an essential tool.
To further illustrate key sales metrics and their importance across different business models, the following table provides a detailed comparison.
The table below, "Core Sales Dashboard Metrics Comparison," outlines essential sales performance metrics and their strategic importance across different business models.
| Metric Category | B2B Sales Focus | B2C Retail Focus | Service Business Focus | Strategic Impact |
|---|---|---|---|---|
| Revenue | Recurring revenue, contract value | Sales per customer, transaction value | Recurring revenue, project value | Top-line growth, profitability |
| Conversion Rates | Lead to opportunity, opportunity to close | Visitor to purchase | Lead to client | Sales efficiency, marketing effectiveness |
| Customer Acquisition Cost (CAC) | Marketing campaign ROI, sales cycle length | Cost per acquisition (CPA), customer lifetime value (CLTV) | Marketing and sales costs per new client | Profitability, sustainable growth |
| Average Deal Size | Contract value, upselling/cross-selling | Average order value (AOV), basket size | Project value, service packages | Revenue growth, sales team performance |
This comparison highlights how different business models prioritize different metrics. While revenue is crucial for all, B2B focuses on contract value, B2C on transaction value, and service businesses on project value. Understanding these nuances is critical for developing targeted strategies.
Building a Balanced Scorecard Approach
Effective sales performance dashboards utilize a balanced scorecard approach, combining lagging and leading indicators for a comprehensive performance view. This helps avoid focusing solely on vanity metrics, which may appear impressive but don't necessarily translate into business growth. For example, a high number of website visits is meaningless without increased sales.
Setting Meaningful Benchmarks
To maximize the effectiveness of your sales performance dashboard, establish realistic benchmarks tailored to your business model, target market, and sales goals. These benchmarks serve as targets and provide a framework for evaluating progress. They should be reviewed and adjusted regularly to reflect changing market conditions and business objectives. For example, a rapidly growing business may need to revise benchmarks more frequently than a mature business with stable growth.
Designing Dashboards That People Actually Use

Creating a sales performance dashboard isn't about flashy visuals; it's about providing accessible and clear insights that drive action. The goal is to move beyond simply presenting data and create dashboards that truly engage users and empower informed decision-making. This means understanding user experience (UX) principles and tailoring the dashboard to the specific needs of different stakeholders. For actionable insights, understanding key metrics is crucial. Resources like these marketing performance indicators can be valuable.
Visualizations That Speak Volumes
Effective data visualization is at the heart of any useful dashboard. Different metrics require different visualization types. Line graphs, for example, are perfect for showing trends over time, like monthly revenue growth. Bar charts effectively compare performance across categories, such as sales by region or product. Pie charts illustrate proportions of a whole, like the contribution of different sales channels to overall revenue. Choosing the right visualization ensures data clarity and understanding.
The Psychology of Color
Color significantly impacts how users perceive data. A consistent color palette promotes quick comprehension. For instance, using green for positive performance and red for negative performance creates an immediate visual cue. However, avoid using too many colors, which can lead to confusion. Color blindness accessibility should also be considered when choosing your palette.
Interactive Elements: Enhancing Understanding
Interactive elements enhance a dashboard's usability by allowing users to explore data more deeply. Filters enable users to focus on specific periods or product categories. Drill-down functionality allows a closer look at individual data points for a more granular view. These elements, however, should be implemented strategically. Overly complex or unnecessary interactive features can clutter the dashboard and make it harder to use.
Avoiding Dashboard Design Pitfalls
Many dashboards are ultimately abandoned because of poor design choices. Information overload is a common issue. Too much data on a single screen can be overwhelming, making it difficult to find valuable insights. Another pitfall is lack of clarity. If the data isn't presented clearly and concisely, users will struggle to understand its meaning. Finally, infrequent updates can make a dashboard obsolete. Data needs regular refreshing to ensure it reflects current performance.
Tailoring Views for Different Roles
A sales director has different needs than a field sales representative. Customizable dashboards allow each person to focus on the metrics most relevant to their role. A sales representative might prioritize individual targets and conversion rates, while a manager focuses on team performance and overall revenue. Tailored views ensure everyone has the information they need to succeed. This personalized approach encourages greater engagement and empowers data-driven decisions at all levels. By adhering to these design principles, businesses can create sales performance dashboards that are not only visually appealing but also truly useful tools, driving performance and informing strategic decision-making.
Retail Dashboard Strategies: Mastering Multi-Channel Sales
For UK retailers, managing multi-channel sales can be complex. Tracking performance across physical stores, online platforms, and mobile apps requires a sales performance dashboard that integrates these diverse data sources. Leading retailers are using dashboards to convert this data into actionable insights, driving strategic decision-making.
Unifying Disparate Data for a Holistic View
Today's retail environment is fragmented, with sales data coming from numerous sources. This makes it challenging to gain a clear overview of performance. A robust sales performance dashboard acts as a central hub, consolidating data from various channels. This provides retailers with a holistic view, showing how each channel contributes to overall results.
Revealing Hidden Connections and Opportunities
A well-designed sales performance dashboard can highlight previously unseen relationships between sales channels. For instance, it could demonstrate how an in-store promotion affected online sales. This type of cross-channel analysis offers valuable information for optimizing marketing investments and maximizing return on investment (ROI). Furthermore, these dashboards can identify cross-selling opportunities, enabling retailers to suggest related products and increase average order value.
Retail sales volumes in Great Britain experienced steady growth through early 2025, emphasizing the need for comprehensive sales performance dashboards in the retail sector. The Office for National Statistics reported sales volumes increased by 0.4% in March 2025, after a revised 0.7% rise in February. This growth led to a 2.6% year-on-year increase to March 2025. Discover more insights about this topic. These dashboards allow retailers to monitor these changes and adapt their strategies accordingly. This shows how a well-structured sales performance dashboard can contribute significantly to profit growth and market adaptability for UK retailers.
Optimizing Inventory Allocation and Margin Analysis
Effective inventory management is vital for retail success. A sales performance dashboard enables retailers to track stock levels across all channels, ensuring the right products are available in the right place at the right time. This optimization minimizes storage expenses and reduces the risk of running out of stock. Moreover, incorporating margin analysis into the dashboard allows retailers to understand the profitability of various products and channels. This information is critical for pricing decisions and optimizing product offerings.
Responding to Market Shifts with Agility
The retail market is constantly changing. Consumer preferences, economic conditions, and seasonal trends all influence sales performance. A sales performance dashboard provides retailers with the real-time data needed to react quickly to market changes. By tracking key metrics and spotting emerging trends, businesses can proactively adjust their strategies, pricing, and promotional activities. This adaptability is essential in today’s competitive environment.
Practical Implementation Strategies for UK Retailers
Implementing a sales performance dashboard doesn't have to be complicated. Here are some helpful strategies:
- Start Small: Focus on a few key metrics initially, then gradually expand the dashboard as needed.
- Choose the Right Platform: Explore options like Mergoio, a profit tracking software for online retailers, to effectively integrate and analyze sales data.
- Prioritize User Experience: Make sure the dashboard is user-friendly and easy to understand for all stakeholders.
- Regularly Review and Refine: Continuously evaluate the dashboard's effectiveness and make adjustments based on changing business requirements.
By using these strategies and harnessing the potential of a sales performance dashboard, UK retailers can gain a competitive advantage in the evolving retail market.
Automotive Insights: Dashboards That Drive Through Volatility
The UK automotive market is known for its dynamism. Influenced by everything from economic shifts and fuel prices to changing consumer preferences and supply chain issues, this inherent volatility makes strong sales performance dashboards crucial. These dashboards help dealerships and manufacturers transform market complexity into manageable strategic frameworks.
Integrating Data for a Comprehensive View
Effective automotive sales dashboards go beyond simply presenting sales figures. They integrate information from multiple sources to create a holistic business overview. Data from sources like manufacturer reports, Dealer Management Systems (DMS), and market intelligence platforms offer valuable insights. These insights provide a clear picture of sales trends, current inventory, and even customer behavior. This data integration allows businesses to identify potential challenges and opportunities, acting as an early warning system for market shifts and disruptions.
Visualizing Key Performance Indicators (KPIs)
A significant advantage of using a sales performance dashboard is the visualization of important metrics. Seeing this data visually makes it easier to identify patterns, trends, and anomalies that might otherwise be missed. Dashboards can track territory performance, highlighting both strong and weak areas. They also provide a clear view of the effectiveness of incentive programs, allowing managers to adjust their strategies for optimal impact. Visualizing inventory allocation also ensures efficient stock levels, minimizing storage expenses and maximizing sales potential.
UK automotive sales can fluctuate significantly from month to month. More detailed statistics can be found here. For instance, March 2025 saw a 12.4% year-on-year rise in new car registrations, reaching 357,103 units, while February experienced a slight dip. This volatility underscores the need for real-time dashboards to enable quick, informed decisions.
Practical Applications and Real-World Examples
The true value of a sales dashboard is its ability to inform better decisions in real-time. This allows UK automotive businesses to respond effectively to market changes, maintain profitability amidst fluctuations, and gain a competitive advantage.
For example, a dealership might use its dashboard to spot a sudden increase in demand for a particular vehicle model. This insight could guide decisions on inventory orders, marketing campaigns, and sales team training. A manufacturer could similarly track the effectiveness of a new incentive program. If the program underperforms, the dashboard can help identify areas for improvement.
The table below provides further detail on the components and benefits of using effective automotive sales dashboards in the UK market.
| Dashboard Element | Data Sources | Key Metrics Tracked | Business Impact | Implementation Complexity |
|---|---|---|---|---|
| Sales by Model | DMS, Manufacturer Reports | Units sold, revenue per model, average selling price | Product strategy, inventory management | Low |
| Territory Performance | CRM, DMS | Sales per territory, market share, lead conversion rate | Sales team deployment, targeted marketing | Medium |
| Incentive Program Effectiveness | DMS, Sales Reports | Sales uplift, ROI, participant engagement | Sales strategy optimization, budget allocation | High |
| Inventory Management | DMS, Supply Chain Data | Stock levels, days to sell, turnover rate | Cost optimization, sales maximization | Medium |
| Customer Satisfaction | CRM, Survey Data | Customer feedback, complaint resolution time | Customer retention, brand reputation | Medium |
These dashboard elements provide actionable insights into various aspects of the automotive sales process, ultimately contributing to better decision-making and improved business performance.
By implementing these strategies, UK automotive businesses can access the information they need to thrive in a competitive market. A robust sales performance dashboard helps businesses navigate volatility and drive profitable growth. By converting data into actionable strategies, businesses can make more informed decisions and improve overall performance.
Implementation Blueprint: From Concept to Company-Wide Adoption
Moving from the idea of a sales performance dashboard to company-wide adoption requires careful planning and effective change management. This roadmap guides you through the process, from securing buy-in to technical setup and long-term usage.
Assessing Your Needs: Focusing on What Matters
Before implementation, understand the specific information needs of different users. Instead of overwhelming them with irrelevant data, conduct thorough needs assessments. Interview stakeholders across departments and levels to identify the key metrics that will inform their decisions. For example, a sales representative might need real-time data on individual targets and conversion rates, while a manager might prioritize team performance and overall revenue.
Integration Strategies: Connecting Your Data Ecosystem
A powerful sales performance dashboard seamlessly integrates with your existing systems. This involves connecting your Customer Relationship Management (CRM) system, like Salesforce, financial platforms, and marketing tools to create a unified performance overview. This integration eliminates data silos and enables better decisions based on a holistic view of the customer journey. Centralizing data also streamlines reporting, improving efficiency and accuracy.
Technical Approaches: Building vs. Buying
Choosing the right technical approach is crucial. You can build a custom solution or opt for a commercial platform.
| Approach | Pros | Cons |
|---|---|---|
| Custom-Built | Highly tailored to specific needs | Requires significant development resources and ongoing maintenance |
| Commercial Platform | Faster implementation, regular updates, and dedicated support | May require customization to perfectly fit all requirements |
Consider your resources, timelines, and technical expertise when deciding. Custom-built dashboards offer maximum flexibility but demand a larger initial investment. Commercial platforms offer quicker implementation but may have customization limitations.
Change Management: Driving Adoption and Engagement
Implementing a new dashboard often changes established workflows. To ensure smooth adoption, employ proven change management techniques. Clearly communicate the dashboard's benefits, provide comprehensive training, and offer ongoing support. Actively solicit user feedback to identify areas for improvement and show that their input is valued. This fosters a sense of ownership and encourages engagement with the new tool. The goal is not just to deploy a system, but to cultivate a data-driven culture where everyone understands the dashboard's value.
For TikTok Shop sellers, Mergoio offers a comprehensive solution with a detailed profit tracking dashboard. This platform allows users to monitor overall performance, analyze product specifics, and understand key sales drivers. Discover how Mergoio can transform your sales performance.
Leave a Reply