
Unlocking Success: Essential Ecommerce Analytics for 2025
Want to boost your ecommerce revenue in 2025? You need to understand your data. This listicle reveals eight essential ecommerce analytics metrics that every online seller, from TikTok Shop entrepreneurs to established retailers, should track. Learn how to use metrics like conversion rate, average order value (AOV), customer lifetime value (CLV), cart abandonment rate, customer acquisition cost (CAC), return on ad spend (ROAS), customer retention rate, and net promoter score (NPS) to inform your strategies and maximize profits. These core ecommerce analytics metrics provide the insights you need to optimise performance and outpace the competition. Tools like Mergoio offer detailed profit tracking for TikTok Shop (and soon Amazon), giving you a comprehensive view of these crucial metrics.
1. Conversion Rate
Conversion rate is arguably the most crucial ecommerce analytics metric for gauging the effectiveness of your online shop. It represents the percentage of visitors to your website who complete a desired action – most importantly, making a purchase. Calculating your conversion rate is straightforward: divide the number of conversions by the total number of visitors and multiply by 100. This metric is fundamental as it directly indicates how effectively your site turns visitors into paying customers, providing a clear measure of your online store's success.

For UK ecommerce entrepreneurs, TikTok Shop sellers, and data-driven retailers, understanding and optimising conversion rate is paramount. A higher conversion rate translates directly to increased revenue and profitability. Features like segmentation by traffic source (e.g., TikTok ads, organic search, email marketing), device type (mobile vs. desktop), and customer demographics allow you to pinpoint areas for improvement and tailor your strategies accordingly. For example, if your mobile conversion rate is significantly lower than desktop, this highlights the need to optimise your mobile checkout experience. Learn more about Conversion Rate
While a typical ecommerce conversion rate benchmark ranges from 1-4%, successful businesses often strive for much higher figures. Amazon, for instance, achieves conversion rates of 10-15% with Prime members through personalised recommendations and the frictionless one-click purchasing experience. Similarly, Shopify stores in the UK that implement targeted exit-intent popups often see conversion rate increases of 2-4%, recovering potentially lost sales. Even established retailers like ASOS have demonstrated the power of conversion rate optimisation, achieving a 50% improvement in mobile conversions by streamlining their checkout process.
Pros:
- Directly tied to revenue generation: A higher conversion rate directly correlates with increased sales and profits.
- Identifies underperforming areas: By segmenting conversion rates, you can pinpoint specific pages, products, or elements that require attention.
- Validates A/B testing: Conversion rate serves as a key metric for measuring the effectiveness of A/B testing experiments.
- More meaningful than raw traffic: While traffic is important, conversion rate shows how effectively that traffic is being converted into customers.
Cons:
- Seasonal fluctuations: Conversion rates can be influenced by seasonal trends and shopping behaviours.
- Doesn't reflect conversion value: A high conversion rate doesn't necessarily indicate high-value sales.
- Misleading without segmentation: Overall conversion rates can mask underlying issues within specific segments.
- Requires accurate tracking: Proper implementation of analytics tools is essential for accurate conversion rate measurement.
Actionable Tips for Improving Conversion Rates:
- Set up conversion funnels: Identify drop-off points in the customer journey and address any friction points.
- Compare conversion rates across traffic sources: Determine which channels are most effective at driving conversions.
- Implement A/B testing on key landing pages: Experiment with different elements like headlines, calls to action, and imagery.
- Focus on improving site speed: A faster website leads to a better user experience and higher conversion rates.
- Use heat mapping tools: Visualise user behaviour patterns to understand how visitors interact with your site.
By focusing on conversion rate optimisation, ecommerce businesses in the UK, from early adoption beta testers to established digital marketing professionals, can significantly improve their bottom line. This metric, popularised by tools like Google Analytics and experts like Neil Patel and Avinash Kaushik, is an essential tool for any data-driven retailer seeking to maximise the return on their marketing investments and achieve sustainable growth in the competitive ecommerce landscape.
2. Average Order Value (AOV)
Average Order Value (AOV) is a key ecommerce analytics metric that represents the average amount a customer spends per order on your online store. It's a simple calculation: Total Revenue / Number of Orders. Understanding your AOV is crucial for assessing the effectiveness of your pricing strategies, marketing campaigns, and overall business performance. By monitoring AOV, you gain insights into customer purchasing behaviour, allowing you to optimise for higher revenue without necessarily needing to increase website traffic. This makes AOV a powerful lever for profitability, especially crucial for UK-based ecommerce businesses navigating a competitive landscape.

AOV provides a valuable snapshot of customer spending patterns. Tracking AOV over time reveals trends and identifies potential issues or opportunities. For instance, a declining AOV might signal pricing problems or ineffective product bundling. Conversely, a rising AOV could indicate successful upselling/cross-selling efforts or a shift towards higher-value products. This metric is even more powerful when segmented. By analysing AOV by product category, marketing channel (e.g., TikTok ads, email marketing), or customer segment, you can pinpoint areas for improvement and tailor strategies for maximum impact. For TikTok Shop sellers in the UK, understanding AOV segmented by product and ad campaign is particularly valuable for optimising ad spend and product offerings.
Features and Benefits:
- Easy calculation: Total Revenue / Number of Orders.
- Insightful: Reveals customer spending habits.
- Trend analysis: Track changes over time to identify growth or decline.
- Segmentable: Analyse AOV by product, channel, or customer type for granular insights.
- Impactful: Directly influences revenue without requiring more traffic.
Pros:
- Boosts revenue without increasing traffic.
- Helps optimise pricing and product bundling strategies.
- Measures the effectiveness of upselling and cross-selling.
- Informs customer acquisition cost (CAC) tolerance.
Cons:
- Doesn't reflect purchase frequency.
- Can be skewed by large or unusual orders and seasonal variations.
- High AOV doesn't guarantee high profit margins.
- Aggregate AOV can mask valuable segment-specific insights.
Examples of Successful Implementation:
- Apple consistently maintains a high AOV through strategic product bundling (e.g., AppleCare, accessories) and targeted recommendations.
- Dollar Shave Club increased AOV by 10% by implementing personalised product recommendations.
- Sephora boosted AOV by 15% with their "frequently bought together" feature, encouraging bundled purchases.
Actionable Tips for UK Ecommerce Businesses:
- Product Bundling: Offer complementary products together at a discounted price to encourage larger orders.
- Free Shipping Thresholds: Set a free shipping threshold slightly above your current AOV to incentivize customers to add more items to their basket.
- Targeted Upselling/Cross-selling: Recommend relevant products during checkout based on items already in the basket.
- Tiered Pricing: Create tiered pricing structures (e.g., volume discounts) to encourage larger purchases.
- Test & Iterate: Experiment with different volume discounts and promotions to find what works best for your audience.
AOV's prominence in popular platforms like Shopify's analytics dashboard and its advocacy by ecommerce experts like Andrew Youderian and Jay Baer underscores its importance. This metric deserves its place in any ecommerce analytics toolkit because it provides a direct, actionable path to revenue growth. For TikTok Shop sellers, data-driven retailers, and digital marketing professionals in the UK, understanding and optimising AOV is not just recommended; it's essential for sustained success.
3. Customer Lifetime Value (CLV or LTV)
Customer Lifetime Value (CLV or LTV) is a crucial ecommerce analytics metric that represents the total revenue a business can expect from a single customer account throughout their relationship. It moves beyond the focus on individual transactions and provides a holistic view of a customer's worth over the long term. Understanding CLV is essential for making informed decisions about sales, marketing, product development, and customer support. By considering purchase frequency, average order value (AOV), and average customer lifespan, CLV offers a comprehensive view of customer profitability, empowering businesses to optimise their strategies and maximize their return on investment. This metric is particularly relevant for ecommerce businesses operating on platforms like TikTok Shop, where building a loyal customer base is key to long-term success.
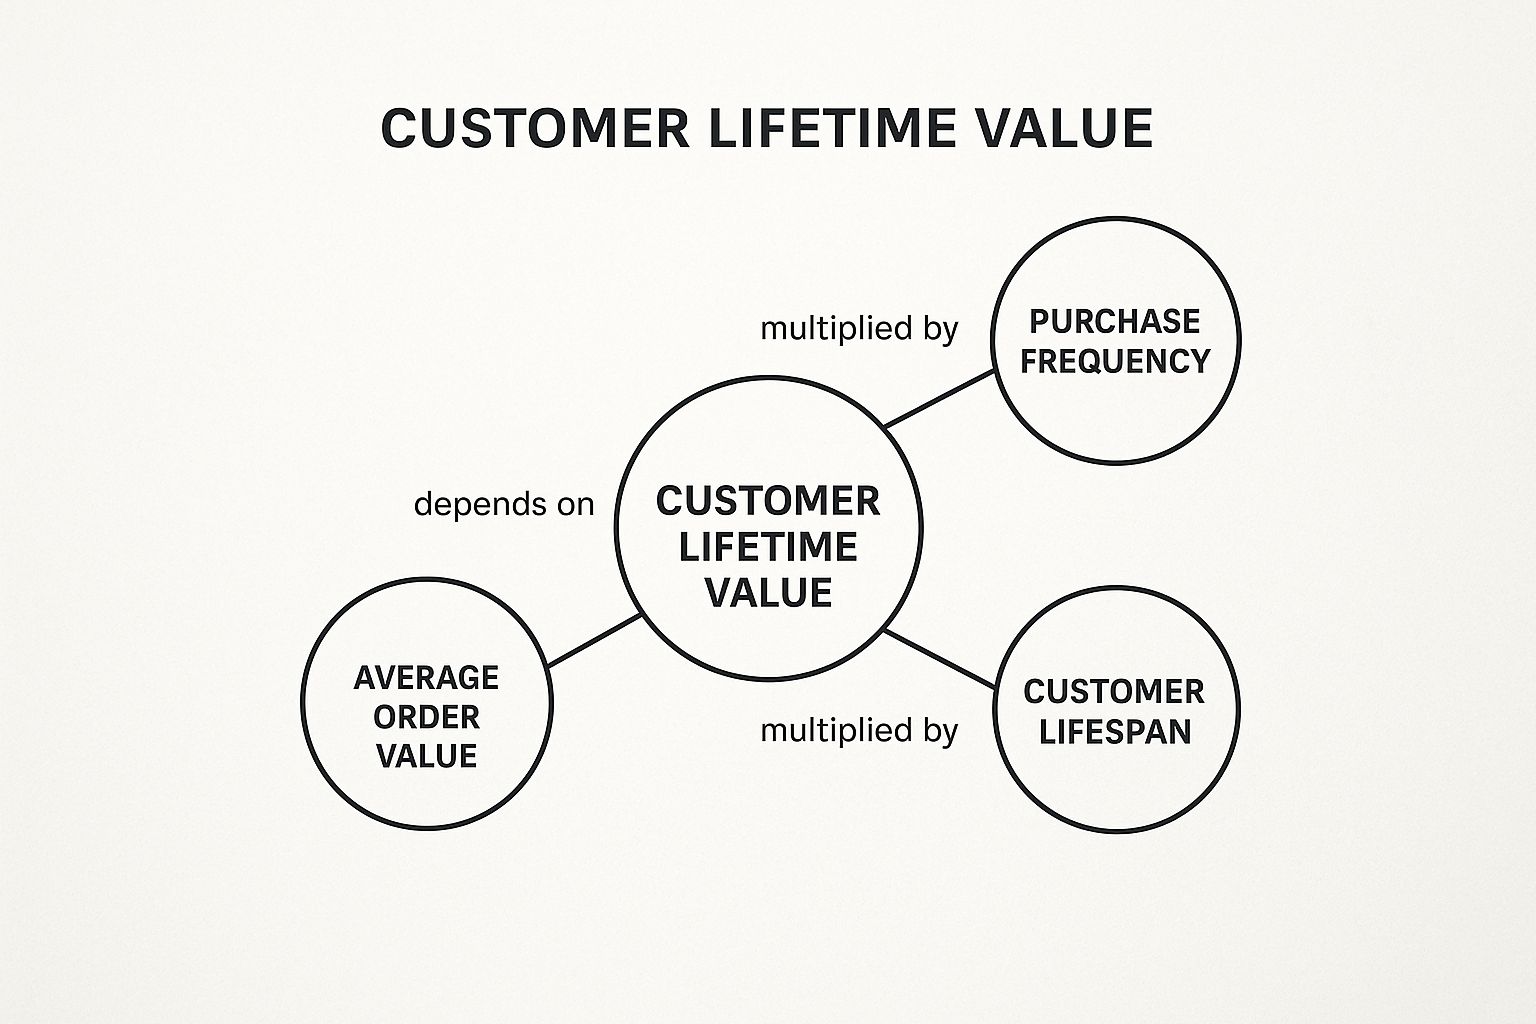
The infographic visualizes the key components and benefits of calculating CLV. The central concept, CLV, is directly influenced by Average Order Value, Purchase Frequency, and Customer Lifespan. These three factors are interconnected; for instance, increased purchase frequency naturally contributes to a higher CLV. The infographic also highlights the benefits of understanding CLV, such as optimized marketing spend and improved customer retention. The most important relationship shown is the direct impact of AOV, purchase frequency, and customer lifespan on CLV, illustrating how improvements in these areas directly translate into higher customer lifetime value.
CLV is calculated using various methods, the most basic being: Average Order Value × Purchase Frequency × Average Customer Lifespan. More sophisticated calculations can incorporate customer acquisition cost (CAC) and discount rates for future cash flows. This metric can be historical (based on past data) or predictive (using statistical models to forecast future revenue). It's often segmented by acquisition channel, demographics, or product categories to identify high-value customer segments. For example, you might find that customers acquired through influencer marketing on TikTok have a higher CLV than those acquired through paid advertising.
Features and Benefits of using CLV as an ecommerce analytics metric:
- Forward-looking metric: CLV projects future revenue potential, allowing for proactive strategy development.
- Segmentation capability: Allows for analysis by different customer groups to identify high-value segments and tailor marketing efforts accordingly.
- Improved ROI calculations: Provides a more accurate understanding of the return on investment for marketing initiatives by considering long-term customer value.
Pros:
- Long-term perspective: Provides insights beyond immediate transactions, enabling strategic planning for sustainable growth.
- Optimised marketing spend: Helps allocate marketing budget effectively by focusing on acquiring and retaining high-CLV customers.
- Customer segmentation: Identifies the most valuable customer segments, allowing for targeted marketing and personalized experiences.
Cons:
- Calculation complexity: Can be challenging to calculate accurately, particularly for newer businesses with limited historical data.
- Data dependency: Requires substantial historical data for precise calculations.
- Market volatility: CLV can fluctuate due to changing market conditions and shifts in customer behavior.
Examples of Successful Implementation:
- Subscription services: Businesses like Amazon Prime demonstrate the power of higher CLV from subscribers compared to one-time purchasers.
- Personalized retention strategies: Companies like Stitch Fix utilise predictive CLV models to personalize retention strategies for high-value customers.
- Customer service prioritisation: Businesses like Chewy.com prioritize customer service based on CLV projections, resulting in improved retention rates.
Actionable Tips for TikTok Shop Sellers and Ecommerce Entrepreneurs in the UK:
- Cohort analysis: Implement customer cohort analysis to track CLV trends over time and identify patterns in customer behaviour.
- Predictive modelling: Utilise predictive modelling to forecast future CLV and identify potential high-value customers.
- Retention strategies: Develop targeted retention strategies specifically for high-CLV segments, offering exclusive discounts or loyalty programs.
- Acquisition cost ceilings: Set customer acquisition cost (CAC) ceilings based on CLV projections to ensure profitability.
- Regular recalculations: Regularly recalculate CLV as customer behaviour and market conditions evolve.
CLV deserves a prominent place in any list of essential ecommerce analytics metrics because it provides a critical understanding of customer profitability and long-term business sustainability. By focusing on CLV, businesses can make data-driven decisions to optimise their marketing spend, improve customer retention, and maximize their overall revenue. For TikTok Shop sellers and other ecommerce entrepreneurs in the UK, understanding and leveraging CLV can be the key to building a thriving and profitable online business.
4. Cart Abandonment Rate
Cart Abandonment Rate is a critical ecommerce analytics metric that measures the percentage of online shoppers who add items to their virtual shopping cart but leave your website without completing the purchase. This metric reveals friction points within the checkout process and highlights significant opportunities for revenue recovery. Considering the global average cart abandonment rate hovers around 70%, optimising for this metric is crucial for any ecommerce business, especially for TikTok Shop sellers, eCommerce entrepreneurs, and data-driven retailers looking to maximise profits.

Calculated as (Number of Abandoned Carts / Number of Initiated Carts) × 100, this metric can be tracked at different stages of the checkout funnel and segmented by device type (mobile vs. desktop), traffic source (ads, organic, social), and product category. It's directly tied to checkout process usability and customer confidence. Understanding your cart abandonment rate is essential for identifying areas for improvement and boosting your bottom line. Learn more about Cart Abandonment Rate
Features and Benefits:
- Pinpoints Conversion Bottlenecks: Identifying the specific stage where users abandon their carts allows you to address the underlying issues, whether it's a complicated form, lack of payment options, or hidden costs.
- Immediate Revenue Recovery: By targeting abandoning shoppers with tailored remarketing campaigns, you can recover lost sales and significantly impact your revenue.
- Targeted Optimisation: Cart abandonment data provides clear targets for optimization efforts, allowing you to prioritize changes that will have the biggest impact.
Pros:
- Identifies specific conversion bottlenecks
- Highlights immediate revenue recovery opportunities
- Provides clear targets for optimization efforts
- Can be addressed with targeted remarketing campaigns
Cons:
- Some abandonment is a natural part of shopping behavior (e.g., browsing, price comparison)
- Requires proper tracking implementation across all checkout steps
- Varies widely by industry and product price point
- Fixing technical issues doesn't always address psychological barriers
Examples of Successful Implementation:
- ASOS: Reduced cart abandonment by 50% by implementing a guest checkout option.
- Wayfair: Uses abandonment data to send targeted emails with personalized discounts, recovering 12% of abandoned carts.
- Best Buy: Decreased mobile cart abandonment by 7% by implementing digital wallet payment options.
Actionable Tips for Reducing Cart Abandonment:
- Exit-Intent Popups: Offer special discounts or incentives to visitors who are about to abandon their carts.
- Automated Email Sequences: Set up automated email reminders for abandoned carts, including personalized product recommendations and special offers.
- Simplified Checkout Forms: Remove unnecessary fields and streamline the checkout process to minimize friction.
- Progress Indicators: Clearly display the checkout completion status to reassure customers and manage expectations.
- Multiple Payment Options: Offer a variety of payment methods, including digital wallets like Apple Pay and Google Pay, to cater to different customer preferences.
- Trust Signals: Display security badges and trust signals prominently during checkout to build customer confidence.
This metric deserves its place on this list of crucial ecommerce analytics metrics because it directly impacts revenue and provides a clear path to optimization. For UK-based TikTok Shop sellers, early adoption beta testers, and other ecommerce professionals, understanding and addressing cart abandonment is paramount for success in today's competitive online marketplace. The insights derived from this metric, coupled with the actionable tips above, can significantly improve conversion rates and contribute to a healthier bottom line.
5. Customer Acquisition Cost (CAC)
Customer Acquisition Cost (CAC) is a crucial ecommerce analytics metric that measures the total cost incurred to acquire a new customer. This includes all marketing and sales expenses, from paid advertising and influencer collaborations to email marketing and sales team salaries. Understanding your CAC is essential for evaluating the effectiveness of your marketing strategies, determining profitable growth, and making informed decisions about resource allocation. Its importance in understanding the overall health and sustainability of your ecommerce business earns it a vital spot in this list of essential metrics.
How CAC Works and Why It Matters for Ecommerce
CAC is calculated by dividing your total marketing and sales costs over a specific period by the number of new customers acquired during that same period:
CAC = Total Marketing & Sales Costs / Number of New Customers Acquired
For TikTok Shop sellers, ecommerce entrepreneurs, and data-driven retailers in the UK, understanding CAC is paramount. It provides a clear picture of how much you're investing to acquire each new customer, allowing you to assess the return on investment (ROI) of your marketing efforts. By analyzing CAC in conjunction with Customer Lifetime Value (CLV – the total revenue you expect from a single customer over their relationship with your business), you can determine the long-term profitability of your customer relationships. Ideally, you want a CLV:CAC ratio of 3:1 or higher, signifying that the value generated by each customer significantly outweighs the cost of acquiring them.
Features and Benefits of Tracking CAC:
- Channel-Specific Calculation: CAC can be calculated overall or broken down by specific marketing channels (e.g., TikTok ads, Google Shopping, influencer marketing) or campaigns. This granular view helps pinpoint your most and least cost-effective acquisition strategies.
- Profitability Driver: CAC directly impacts your unit economics and overall business profitability. Lowering your CAC while maintaining or increasing CLV is key to sustainable growth.
- Data-Driven Budget Allocation: CAC data empowers you to make informed decisions about where to allocate your marketing budget. You can invest more in high-performing channels and optimize or eliminate underperforming ones.
Pros:
- Clear ROI Measurement: Provides a quantifiable measure of marketing ROI.
- Channel Optimization: Identifies the most cost-effective acquisition channels.
- Sustainable Growth: Essential for determining and managing sustainable growth rates.
- Data-Driven Decisions: Enables data-driven budget allocation and strategy adjustments.
Cons:
- Attribution Challenges: Attributing costs precisely in multi-touch customer journeys can be complex. A customer might interact with several touchpoints (e.g., see a TikTok ad, visit your website, receive an email) before making a purchase, making it challenging to assign accurate value to each touchpoint.
- Long-Term Impact: May not fully account for brand-building activities that have a longer-term impact on customer acquisition.
- Fluctuations: CAC can fluctuate seasonally or during promotional periods, requiring careful interpretation of the data.
- Consistent Tracking: Requires a consistent tracking methodology across all channels for accurate comparisons.
Examples of Successful CAC Optimization:
- Glossier: Maintains a low CAC through their referral program and user-generated content strategy, leveraging organic growth and word-of-mouth marketing.
- Casper: Reduced their CAC by optimizing their paid search strategy based on conversion data, identifying and focusing on high-performing keywords and demographics.
- Allbirds: Achieves a below-industry CAC by leveraging sustainability messaging for organic growth and building a strong brand community.
Actionable Tips for TikTok Shop Sellers and Ecommerce Entrepreneurs:
- Calculate Channel-Specific CAC: Break down your CAC by channel to understand which methods are most efficient. This is especially crucial for TikTok Shop sellers navigating a relatively new platform.
- Implement Attribution Modeling: Explore attribution models (e.g., first-click, last-click, multi-touch) to better understand the value of different touchpoints in the customer journey.
- Focus on Conversion Rates: Improving your website and checkout conversion rates can lower your CAC without reducing your marketing spend.
- Develop Referral Programs: Encourage word-of-mouth marketing and reduce acquisition costs through referral programs. This can be particularly effective within the TikTok community.
- Monitor CAC Trends: Track your CAC over time and in relation to market saturation to identify potential issues and adjust your strategies proactively.
By consistently monitoring and optimizing your CAC, you can ensure profitable customer acquisition, sustainable growth, and a thriving ecommerce business, whether you're selling on TikTok Shop or other platforms in the UK.
6. Return on Ad Spend (ROAS)
Return on Ad Spend (ROAS) is a crucial ecommerce analytics metric that measures the revenue generated for every pound spent on advertising. For TikTok Shop sellers, eCommerce entrepreneurs, and data-driven retailers in the UK, understanding and optimising ROAS is essential for profitable growth. This metric provides a granular view of your marketing performance, allowing you to assess the effectiveness of specific campaigns and channels, and ultimately, maximise your return on investment. Its importance within the broader context of ecommerce analytics metrics stems from its ability to directly link advertising expenditure to revenue generation, enabling data-driven decision-making and efficient budget allocation.
How ROAS Works:
ROAS is calculated by dividing the revenue generated from an advertising campaign by the cost of that campaign:
ROAS = Revenue from Ad Campaign / Cost of Ad Campaign
The result is typically expressed as a ratio (e.g., 4:1) or a percentage (400%). A 4:1 ROAS signifies that for every £1 spent, £4 in revenue is generated. This metric can be calculated at various levels of granularity, including the campaign, ad group, keyword, or even individual channel level, providing valuable insights into performance across different aspects of your marketing strategy. Importantly, ROAS focuses solely on advertising costs, excluding other marketing or operational expenses.
Why ROAS Matters:
In the fast-paced world of ecommerce, especially on platforms like TikTok Shop, optimising ad spend is critical. ROAS helps you pinpoint which campaigns are truly driving revenue and which are underperforming. This allows for data-backed decisions, enabling you to shift budget towards high-performing areas and eliminate wasteful spending. Unlike broader metrics like overall ROI, ROAS provides a laser focus on advertising performance, making it invaluable for digital marketing professionals and early adoption beta testers seeking to refine their strategies.
Pros of Using ROAS:
- Clear Performance Measurement: Provides a quantifiable measure of campaign effectiveness.
- Direct Channel Comparison: Enables easy comparison of performance across different marketing channels (e.g., TikTok Ads vs. Google Ads).
- Optimization Opportunities: Identifies underperforming campaigns, allowing for adjustments and improved efficiency.
- Specific Decision-Making: Offers more granular insights than general ROI for marketing decisions.
Cons of Using ROAS:
- Customer Lifetime Value: Doesn't account for the long-term value of acquired customers.
- Short-Term Focus: May encourage prioritising immediate returns over long-term brand building.
- Attribution Challenges: Difficult to accurately attribute conversions in multi-touch customer journeys.
- Profit Margins: Doesn't factor in profit margins or other operational costs.
Examples of Successful ROAS Implementation:
- A fashion retailer, similar to Boohoo, achieved a 7:1 ROAS on TikTok by incorporating trending sounds and influencer collaborations in their ads.
- A home goods store, mirroring Home Depot's strategy, saw a 10:1 ROAS by using TikTok Shopping Ads to showcase product availability and drive direct purchases.
- A subscription box service, learning from MeUndies, improved ROAS by 25% by implementing interest-based targeting on TikTok.
Actionable Tips for Optimising ROAS:
- Targeted ROAS Goals: Set different ROAS targets for different stages of the customer journey (e.g., higher ROAS for retargeting campaigns).
- Accurate Tracking: Implement TikTok Pixel and conversion events for precise measurement.
- Automated Bidding: Leverage TikTok's automated bidding strategies based on ROAS targets.
- Attribution Modelling: Explore different attribution models to understand the true impact of your campaigns.
- Incrementality Testing: Consider incrementality testing to measure the actual lift generated by your advertising efforts.
Popularised By:
The increasing focus on ROAS is driven by platforms like Google Ads and Facebook Ads, which feature ROAS as a key optimization metric. Additionally, performance marketing experts and resources dedicated to TikTok advertising are contributing to its widespread adoption. By focusing on ROAS, UK-based TikTok Shop sellers and eCommerce entrepreneurs can strategically allocate their advertising budgets and maximise their profitability within this dynamic marketplace.
7. Customer Retention Rate
Customer Retention Rate (CRR) is a critical ecommerce analytics metric that measures the percentage of customers who continue to make purchases from your business over a defined period. For TikTok Shop sellers, ecommerce entrepreneurs, and data-driven retailers in the UK, understanding and optimising CRR is paramount for long-term profitability and sustainable growth. This metric deserves its place on this list of essential ecommerce analytics metrics because it provides invaluable insights into customer loyalty and the effectiveness of your retention strategies. It’s especially important in the fast-paced world of TikTok Shop, where capturing and keeping a customer’s attention is vital.
How It Works:
CRR is calculated as follows:
((Customers at End of Period - New Customers During Period) / Customers at Start of Period) × 100
This formula essentially looks at how many customers you retained from an existing pool, excluding any new customers acquired during the measured period. It's typically calculated monthly, quarterly, or annually. You can further refine this metric by segmenting it by cohorts (e.g., customers acquired through a specific TikTok campaign), acquisition channels (e.g., organic vs. paid), or customer types (e.g., high-value vs. low-value).
Features and Benefits:
- Direct Impact on Customer Lifetime Value (CLTV): CRR directly influences CLTV. Higher retention means customers stick around longer, making more purchases over their lifetime and boosting your profitability.
- Predictive Power: Strong CRR indicates robust customer relationships, product satisfaction, and ultimately, long-term business sustainability.
- Cost-Effectiveness: Retaining existing customers is significantly cheaper (5-25 times less expensive) than acquiring new ones. In the competitive TikTok Shop landscape, this can be a huge advantage.
- Word-of-Mouth Marketing: Happy, retained customers are more likely to recommend your products or shop, leading to organic growth and reduced customer acquisition costs (CAC).
Pros:
- Strong indicator of customer relationship strength and product satisfaction.
- Predicts long-term business sustainability.
- Highlights the effectiveness of loyalty programs and customer service.
- Typically correlates with increased word-of-mouth referrals and reduced CAC.
Cons:
- Defining an "active customer" can vary depending on your business model and purchase cycle.
- May not distinguish between high-value and low-value retained customers.
- Can be artificially inflated by subscription models with difficult cancellation processes.
- Requires a sufficient historical data period for meaningful analysis.
Examples of Successful Implementation:
- Ipsy: This beauty subscription service maintains 80%+ retention rates through personalized product recommendations and community building.
- Chewy.com: Achieves industry-leading pet supply retention with exceptional customer service, including sending sympathy cards for pet loss.
- Dollar Shave Club: Improved retention by 20% by implementing a flexible subscription management system.
Actionable Tips for TikTok Shop Sellers and Ecommerce Entrepreneurs:
- Implement post-purchase email sequences: Engage customers after they buy with targeted product recommendations, exclusive offers, and valuable content related to their purchase.
- Create a loyalty program: Offer meaningful benefits for repeat purchases, such as exclusive discounts, early access to new products, or free gifts.
- Analyze churn patterns: Identify common exit points in the customer journey and implement strategies to address them.
- Use cohort analysis: Understand retention differences by acquisition period to optimize your marketing efforts.
- Collect and act on customer feedback: Regularly solicit feedback and use it to improve your products, services, and overall customer experience.
When and Why to Use This Approach:
CRR should be a core component of your ongoing ecommerce analytics strategy. Monitor it regularly to identify trends, evaluate the success of your retention initiatives, and pinpoint areas for improvement. For TikTok Shop sellers specifically, focusing on CRR can help build a loyal customer base within this dynamic platform.
Learn more about Customer Retention Rate
By focusing on CRR, digital marketing professionals and early adoption beta testers can gain a competitive edge in the evolving ecommerce landscape, especially within platforms like TikTok Shop, where building a loyal following translates directly to sustained success and profit tracking.
8. Net Promoter Score (NPS)
Net Promoter Score (NPS) is a crucial ecommerce analytics metric that gauges customer loyalty and satisfaction, providing valuable insights into the health of your business. It works by asking a simple but powerful question: "On a scale of 0 to 10, how likely are you to recommend [Your Company/Product] to a friend or colleague?" This single question helps categorize your customers into three groups:
- Promoters (9-10): These are your loyal enthusiasts, likely to drive repeat business and spread positive word-of-mouth. They are your brand ambassadors.
- Passives (7-8): Satisfied but not enthusiastic, these customers are susceptible to competitive offerings and may not actively promote your brand.
- Detractors (0-6): Unhappy customers who may churn and potentially damage your brand reputation through negative reviews or feedback.
Your NPS is then calculated by subtracting the percentage of Detractors from the percentage of Promoters, resulting in a score ranging from -100 to +100. A higher NPS generally indicates stronger customer loyalty and a greater potential for growth. This metric deserves a place in any ecommerce analytics toolkit as it's a leading indicator of customer experience quality and future performance.
Why NPS Matters for Ecommerce Analytics:
In the competitive ecommerce landscape, understanding customer sentiment is paramount. NPS provides a standardized metric for measuring this sentiment, enabling you to benchmark your performance against competitors and identify areas for improvement. For TikTok Shop sellers, eCommerce entrepreneurs, and data-driven retailers, NPS is especially relevant due to the platform's emphasis on community and social proof. Positive word-of-mouth and recommendations are vital for success on TikTok, and a high NPS can signify a thriving and engaged customer base.
Features and Benefits:
- Simple and Understandable: The 0-10 scale is easy for customers to grasp, resulting in higher response rates.
- Correlation with Growth: NPS has been shown to correlate with revenue growth and customer retention.
- Identification of Advocates: Pinpoint your Promoters for testimonials, referral programs, and user-generated content.
- Early Warning System: Detractor feedback provides valuable insights into customer experience issues and areas needing improvement.
- Benchmarking: Compare your NPS against industry averages and competitors to understand your relative performance.
Pros and Cons:
- Pros: Easy to implement, correlates with growth, identifies brand advocates, provides early warning of issues.
- Cons: Doesn't provide in-depth reasons for customer sentiment, cultural differences can influence scores, doesn't measure actual referrals.
Examples of Successful Implementation:
- Apple: Known for its exceptional customer service and product experience, Apple consistently maintains high NPS scores, often above 70.
- Zappos: Their customer-first approach and generous return policy have driven industry-leading NPS.
- Trader Joe's: This popular grocery chain achieves high NPS through its unique product selection and friendly in-store experience.
Actionable Tips for UK Ecommerce Businesses:
- Follow-up Questions: Include open-ended questions after the NPS survey to understand the "why" behind the score. For example, "What could we do to improve your experience?"
- Segmentation: Analyze NPS by customer segments (e.g., new vs. returning, high-value vs. low-value) to identify specific areas for improvement.
- Closed-Loop Feedback: Implement processes to address Detractor feedback promptly and effectively. Show customers you value their opinions.
- Trend Analysis: Track NPS over time to identify trends and measure the impact of your customer experience initiatives.
- Combine with Other Metrics: Use NPS alongside other customer experience metrics like Customer Effort Score (CES) for a more holistic view.
Popularized By:
Developed by Fred Reichheld and Bain & Company, and further popularized by Satmetrix Systems and customer experience expert Jeanne Bliss, NPS has become a widely adopted metric for measuring customer loyalty.
By focusing on improving your NPS, you can build a loyal customer base, drive positive word-of-mouth marketing (especially crucial for TikTok Shop success), and ultimately boost your bottom line. This makes NPS a valuable ecommerce analytics metric for businesses in the UK and beyond.
Key Ecommerce Analytics Metrics Comparison
| Metric | Implementation Complexity 🔄 | Resource Requirements ⚡ | Expected Outcomes 📊 | Ideal Use Cases 💡 | Key Advantages ⭐ |
|---|---|---|---|---|---|
| Conversion Rate | Low – Simple tracking and segmentation | Moderate – Requires tracking setup | Directly measures site effectiveness and revenue impact | Optimizing user experience, A/B testing | Directly tied to revenue, actionable for optimization |
| Average Order Value (AOV) | Low – Basic revenue/order data calculation | Low – Uses existing sales data | Insight into customer spending and pricing effectiveness | Pricing strategies, product bundling | Impacts revenue without increasing traffic |
| Customer Lifetime Value (CLV or LTV) | High – Complex calculations, predictive modeling | High – Needs historical data & analytics tools | Long-term revenue forecasting and customer valuation | Marketing budget planning, retention strategies | Guides sustainable acquisition and ROI decisions |
| Cart Abandonment Rate | Moderate – Requires tracking checkout funnel stages | Moderate – Analytics and remarketing tools | Identifies checkout friction and revenue recovery areas | Improving checkout flow, remarketing campaigns | Highlights immediate optimization opportunities |
| Customer Acquisition Cost (CAC) | Moderate – Aggregates marketing and sales expenses | Moderate – Data from multiple channels | Measures marketing efficiency and cost-effectiveness | Budget allocation, channel optimization | Clear ROI metric, guides growth spending |
| Return on Ad Spend (ROAS) | Moderate – Campaign-level revenue & cost tracking | Moderate – Ad platform integrations | Evaluates specific ad campaign profitability | Ad campaign optimization, channel comparison | Granular campaign performance measurement |
| Customer Retention Rate | Moderate – Cohort and customer activity tracking | Moderate – CRM and analytics tools | Measures loyalty and long-term customer engagement | Loyalty programs, subscription businesses | Correlates with profitability, reduces acquisition cost |
| Net Promoter Score (NPS) | Low – Survey implementation and analysis | Low – Survey tools and follow-up | Gauges customer loyalty and satisfaction | Customer experience, brand reputation management | Simple to collect, early indicator of growth potential |
Taking Action: Using Ecommerce Analytics Metrics to Drive Growth
Mastering your ecommerce analytics metrics is the key to unlocking sustainable growth for your online business. Throughout this article, we've explored eight crucial metrics – from conversion rate and average order value (AOV) to customer lifetime value (CLV) and customer acquisition cost (CAC) – that provide a comprehensive view of your ecommerce performance. Understanding these metrics, particularly for those operating within the dynamic landscape of TikTok Shop and other online marketplaces in the UK, allows you to identify areas for improvement, optimise your strategies, and ultimately boost your bottom line. By analysing metrics like return on ad spend (ROAS), cart abandonment rate, customer retention rate, and even net promoter score (NPS), you gain invaluable insights into customer behaviour and the effectiveness of your marketing efforts.
The most successful TikTok Shop sellers, ecommerce entrepreneurs, and digital marketing professionals in the UK are those who embrace data-driven decision-making. Whether it's refining your pricing to optimise AOV, streamlining your checkout process to reduce cart abandonment, or targeting your marketing campaigns to lower CAC and improve ROAS, these ecommerce analytics metrics provide the compass you need to navigate the complexities of online retail. By actively monitoring and analysing these key performance indicators (KPIs), you can identify emerging trends, adapt to changing market conditions, and stay ahead of the competition.
In the fast-paced world of ecommerce, having the right tools can make all the difference. Leveraging these key ecommerce analytics metrics is made even more powerful with a comprehensive analytics platform. Want to streamline your analytics tracking and gain a deeper understanding of your business performance? Explore how Mergoio can help you elevate your ecommerce strategies and thrive in 2025 and beyond. Visit Mergoio today to discover how you can transform your data into actionable insights and achieve sustainable growth.
Leave a Reply