The Power Behind Modern Retail Success
E-commerce in the UK is booming. Simply having an online presence isn't enough anymore. Thriving in this competitive market requires a deep understanding of customer behavior. This is where the e-commerce analytics dashboard comes in, providing a powerful tool for modern retail success. These platforms have evolved from basic reporting tools into comprehensive intelligence systems. They provide the insights needed to make data-driven decisions that can significantly improve a business.
From Data to Decisions: How Dashboards Empower Retailers
Imagine navigating a busy city without a map. That's essentially what it's like running an e-commerce business without an analytics dashboard. These dashboards consolidate critical data, providing a clear overview of your performance. They empower retailers to understand not just what is happening, but why. This allows for quick responses to market trends, customer preferences, and new opportunities.
For example, imagine a sudden spike in traffic to a specific product page. An e-commerce analytics dashboard can reveal the traffic source, helping you understand if it's from a successful social media campaign or a surge in organic search interest. This allows you to capitalize on that momentum.
These dashboards also offer valuable insights into customer demographics, purchasing patterns, and even website navigation. This detailed information allows for highly targeted marketing and personalized customer experiences.
Real-World Impact: How UK Retailers Benefit
Retailers across the UK, from small businesses to large corporations, are realizing the benefits of using an e-commerce analytics dashboard. These tools are being used for everything from optimizing omnichannel strategies to improving last-mile delivery efficiency. The UK's e-commerce analytics market is projected to reach US$25.72 billion by 2025, reflecting the rapid digital growth of the region. Find more detailed statistics here This growth is fueled by the increasing adoption of these dashboards by major players like Tesco and ASDA, who understand the value of data-driven decisions.
The Competitive Edge: Staying Ahead of the Curve
In today's dynamic retail environment, an e-commerce analytics dashboard is no longer a luxury, but a necessity. It provides the competitive edge needed not just to survive, but to thrive. By using data visualization and analysis, retailers can unlock valuable insights into their business performance, customer behavior, and market trends. This allows them to make informed decisions, optimize their operations, and ultimately, drive revenue growth. The following section explores specific metrics that drive retail growth.
Metrics That Actually Drive Retail Growth
Forget vanity metrics. Let's focus on the numbers that truly impact your bottom line. By analyzing high-performing UK retail brands, we can pinpoint the key performance indicators (KPIs) that matter most at different business stages. This involves weaving seemingly disparate metrics into a coherent narrative about your business's health. Think everything from conversion rates and customer acquisition costs to lifetime value and inventory efficiency.
Essential KPIs for UK E-commerce Success
To begin, it's essential to understand the crucial role of an e-commerce analytics dashboard. These dashboards act as a central hub for all your vital data, allowing you to monitor your business performance in real-time. Tools like the Shopify Analytics Dashboard exemplify the power behind modern retail success.
Some of the most impactful metrics for UK retailers include:
-
Conversion Rate: This indicates the percentage of website visitors who complete a desired action, such as making a purchase. A higher conversion rate directly translates to increased sales.
-
Average Order Value (AOV): This metric reveals the average amount spent per customer transaction. Increasing AOV can significantly boost revenue. Strategies like upselling and cross-selling can help achieve this.
-
Customer Acquisition Cost (CAC): Understanding how much it costs to acquire a new customer is crucial for sustainable growth. Lowering CAC improves profitability.
-
Customer Lifetime Value (CLTV): This metric predicts the total revenue a business expects from a single customer throughout their relationship. Maximizing CLTV is key for long-term success.
-
Inventory Turnover Rate: This measures how efficiently a business manages its inventory. A higher turnover rate generally indicates strong sales and reduced storage costs.
To illustrate how these KPIs can differ across various e-commerce models, let's examine some benchmarks:
Key Ecommerce Dashboard Metrics Comparison:
Comparison of essential metrics for different types of ecommerce businesses with UK benchmarks
| Metric | B2C Retail | B2B Ecommerce | Marketplace | UK Benchmark |
|---|---|---|---|---|
| Conversion Rate | 2-4% | 1-3% | 3-5% | 2.8% |
| Average Order Value (AOV) | £50-100 | £200-500 | £25-75 | £75 |
| Customer Acquisition Cost (CAC) | £10-20 | £50-100 | £5-15 | £15 |
| Customer Lifetime Value (CLTV) | £200-500 | £1000-2000 | £100-300 | £300 |
| Inventory Turnover Rate | 6-8 | 4-6 | 8-12 | 7 |
The table above provides a general overview. Specific benchmarks will vary based on industry, product category, and individual business strategies. For example, B2C businesses often see higher conversion rates on marketplaces due to increased visibility and consumer trust. However, marketplaces also tend to have lower AOVs compared to dedicated B2C retail sites.
Setting Benchmarks and Custom Alerts
Building on these KPIs, setting meaningful benchmarks is crucial. These benchmarks provide context and help you understand how your performance compares to competitors within your specific retail category. For example, a luxury fashion retailer in London will likely have a different AOV than a budget-friendly online grocery store.
Additionally, setting up custom alerts within your e-commerce analytics dashboard can prevent problems before they escalate. For instance, an alert for a sudden drop in conversion rate could signal a technical issue on your website or a problem with your checkout process. Addressing these issues quickly can save you lost sales and frustrated customers.
The UK leads Europe in e-commerce activity, with retail e-commerce revenue projected to reach $160 billion in 2024—a benchmark that underscores the importance of robust analytics dashboards for tracking performance and user behavior. Amazon dominates the UK's online shopping market, attracting more than 400 million monthly visitors in 2024, while Shopify holds a notable 21% share of the market. Discover more insights about UK e-commerce. This dominance highlights the increasing competition and the need for data-driven decisions.
Creating Actionable Dashboard Views
Finally, your e-commerce analytics dashboard shouldn't be a source of confusion. It should inspire action. Customising your dashboard to display the most relevant metrics for your business goals is crucial. This might involve creating different dashboard views for different teams or projects. A marketing team might focus on metrics like website traffic and conversion rates, while an operations team might prioritize inventory turnover and fulfilment efficiency. This allows each team to access the information they need quickly and efficiently, ultimately leading to better decision-making and stronger business performance.
Selecting The Right Dashboard For Your Business
With so many analytics platforms available, choosing the right e-commerce analytics dashboard can be a daunting task. How can you navigate the options and identify the solution that will truly benefit your business? This section simplifies the crowded marketplace, from established platforms like Google Analytics 4 and Adobe Analytics to more specialized e-commerce solutions designed for UK retailers.
Key Considerations For UK Businesses
Choosing an effective e-commerce analytics dashboard requires careful consideration of several important factors.
-
Pricing: Evaluate pricing models against the value they offer. Some platforms use tiered pricing based on features and data volume, while others use subscriptions. Understanding the various ecommerce subscription models is crucial for selecting the right metrics to monitor.
-
Integration: Seamless integration with your existing technology—including your e-commerce platform, CRM, and marketing automation tools—is essential. A dashboard that integrates smoothly with your current systems will streamline data flow and reduce manual work.
-
Compliance: The platform must comply with UK data privacy regulations, especially GDPR. This protects customer data and helps avoid legal problems.
-
Scalability: Consider your business's future growth. The platform you choose should be able to handle growing data volumes and changing business needs as you scale.
Evaluating Platforms In Real-World Scenarios
It's crucial to look beyond the marketing and understand how different platforms perform in real-world scenarios. We'll explore the practical strengths and weaknesses of various e-commerce analytics dashboards through discussions with implementation experts and UK retailers. This will include frank assessments of implementation difficulties, resource needs, and the long-term effects on businesses at various stages of growth.
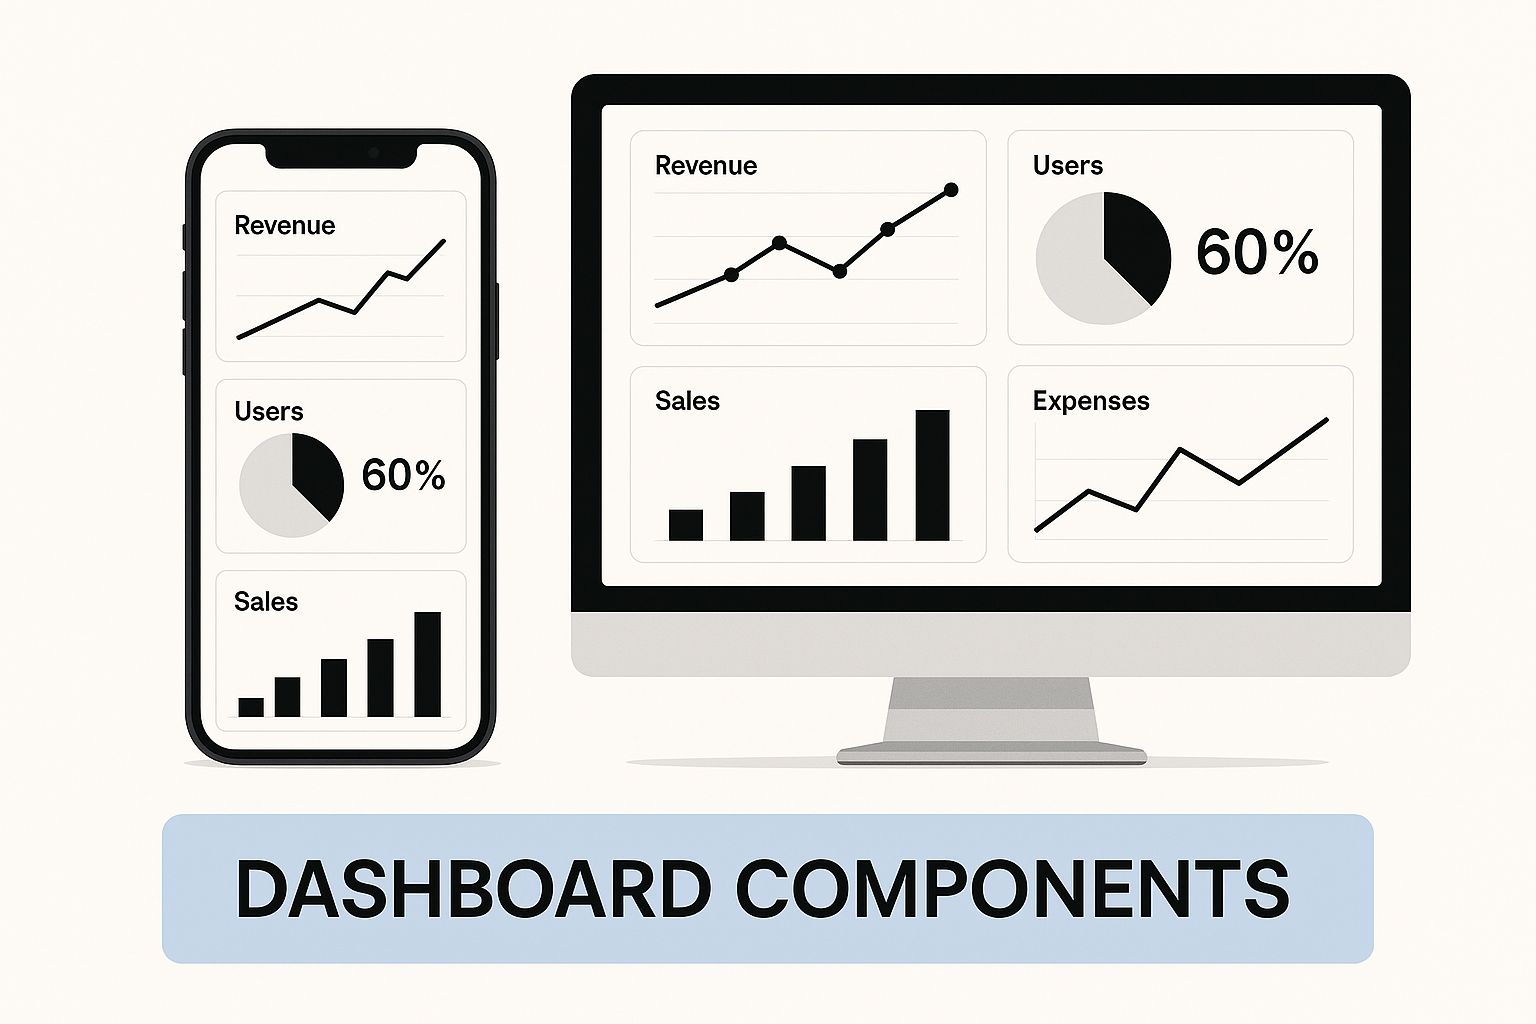
The infographic above illustrates the modular nature of a modern e-commerce analytics dashboard, showing how components can be configured on desktop and mobile devices. This flexibility is crucial for accessing important data on the go, enabling business owners to react quickly to market changes. It also allows for the creation of custom dashboards that display the most relevant metrics for individual business requirements.
From Google To Niche Solutions
Established platforms like Google Analytics 4 offer a lot of data and features, often at a competitive price. However, they may not include specific functions needed by e-commerce businesses. This is where niche solutions, designed specifically for online retail, are valuable. These platforms frequently offer features like real-time inventory tracking, cohort analysis for customer segmentation, and advanced attribution modeling for marketing campaign optimization.
To help illustrate the differences, let's look at a comparison of a few popular platforms in the UK:
Ecommerce Analytics Platform Comparison
Detailed comparison of leading ecommerce analytics dashboard solutions available in the UK market
| Platform | Best For | Key Features | Price Range | UK Market Share (Illustrative) |
|---|---|---|---|---|
| Google Analytics 4 | Businesses of all sizes seeking a free and comprehensive analytics solution | Website traffic analysis, conversion tracking, custom reporting | Free | High (estimated 60%+) |
| Adobe Analytics | Large enterprises needing advanced analytics and marketing insights | Customer journey analysis, predictive analytics, cross-channel data integration | High (bespoke pricing) | Medium (estimated 15-20%) |
| Shopify Analytics | Businesses using the Shopify platform | Sales tracking, customer behavior analysis, product performance insights | Included with Shopify plans | Medium (tied to Shopify's UK share) |
| A Niche Platform (Example) | Specific e-commerce needs like inventory or advanced attribution | Real-time inventory tracking, cohort analysis, advanced attribution modeling | Medium (subscription-based) | Low (niche market) |
This table provides a simplified overview. Specific market share data is often proprietary and difficult to obtain. However, it highlights the key differences in features and pricing between general analytics solutions and more specialized platforms.
Choosing the right e-commerce analytics dashboard is a vital step in creating a data-driven retail business. Carefully evaluating your specific needs and the available platforms will help you find the ideal tool to reveal valuable insights and promote lasting growth. This careful selection is a worthwhile investment.
Building Your Custom Analytics Command Center
Off-the-shelf e-commerce analytics dashboards are great for general overviews, but sometimes you need more specialized insights. A custom dashboard can become a significant competitive advantage when you require truly bespoke data. Building one is a strategic process, not just a technical exercise. Let's explore how successful UK retailers plan and build analytics systems aligned with their unique business models.
Identifying Your Mission-Critical Metrics
Before writing any code, you need clarity on your goals. What Key Performance Indicators (KPIs) truly matter to your business? A fashion boutique in Chelsea might prioritize average order value and return rates, while a Birmingham-based electronics retailer might focus on customer lifetime value and warranty claims. This initial stage involves careful introspection and cross-department collaboration.
For example, your marketing team might need data on campaign attribution, accessible through tools like Google Analytics. Your operations team, on the other hand, might need real-time inventory levels. A custom dashboard allows you to tailor the data presented to each team's specific needs. This targeted approach improves efficiency and ensures everyone works with the most relevant information.
This means understanding which metrics provide actionable insights, not just interesting data points. This focused approach guides your dashboard design and ensures you're collecting the right data from the outset.
Integrating Your Data Universe
Modern retailers often have data spread across various systems: e-commerce platforms like Shopify, Customer Relationship Management (CRM)) software like Salesforce, marketing automation tools, and more. Integrating these disparate sources into a single, unified view is a core challenge in custom dashboard development. Thankfully, several APIs and data warehousing solutions, such as Amazon Redshift, are available to help consolidate this information.
Think of your data sources as tributaries flowing into a central river – your custom dashboard. Each tributary contributes valuable information, but only when combined do they create a powerful current of insight.
This integration process can be complex, but the payoff is significant. A unified data view provides a complete understanding of customer behavior, operations, and overall business performance, enabling better decision-making.
Visualization: Turning Data Into Decisions
Data without visualization is like a treasure chest without a key. Effective visualization transforms complex data into clear, actionable insights. It's about more than just creating attractive charts.
Consider using color-coding to highlight key trends, interactive filters to explore specific data segments, and intuitive layouts to guide the user's focus. For instance, a heatmap could visualize website traffic patterns, revealing popular and underperforming pages. Tools like Tableau can be incredibly helpful for this.
This focus on usability is crucial. A well-designed dashboard empowers users across your organization to interpret data easily and make informed decisions. This democratization of data leads to a more agile and responsive business.
Navigating Common Roadblocks
Custom dashboard development isn't always straightforward. Data quality issues, stakeholder alignment challenges, and technical limitations can create obstacles.
However, these challenges are manageable. Proactive communication, rigorous data validation, and a phased implementation approach can mitigate these risks. Many UK retailers have successfully built robust and insightful dashboards that drive significant business value. Their experiences offer valuable lessons for those on a similar journey. Building a custom e-commerce analytics dashboard is a substantial undertaking, but the potential rewards – a truly data-driven business with a distinct competitive edge – make it a worthwhile investment for any UK retailer.
Transforming Dashboard Insights Into Revenue
An e-commerce analytics dashboard, full of colorful charts and graphs, isn't effective if it doesn't improve your profits. It's not enough to simply see the data; you must use it to make informed decisions that increase revenue. This section explores how successful UK retailers turn dashboard insights into strategic action.
Frameworks For Analyzing Dashboard Trends
Developing a systematic approach to analyzing your dashboard is the first step. This begins with recognizing key trends. Are your conversion rates consistently improving? Is your average order value dropping? Spotting these patterns requires regular monitoring and attention to detail.
For example, a sudden decrease in website traffic might relate to a recent change in a marketing campaign. A sudden rise in sales of a specific product could be connected to seasonal demand or a successful social media promotion. An e-commerce analytics dashboard lets you make these connections and understand the reasons behind the numbers. This understanding allows you to take advantage of positive trends and address negative ones head-on.
This means looking beyond surface-level observations and digging deeper into the data. Why are customers abandoning their online shopping carts? What are the most popular product categories? Which marketing channels bring in the most valuable customers? Your dashboard can answer these questions, offering a detailed understanding of customer behavior and business performance.
Communicating Insights Across Departments
Data insights shouldn't stay within a single team. Sharing this information across departments – marketing, sales, operations, and customer service – makes sure everyone works toward the same objectives.
This could involve creating specific dashboard views for each department, highlighting the most relevant metrics. For instance, the marketing team might benefit from seeing website traffic, conversion rates, and campaign performance data. The operations team, however, might need information on inventory levels, fulfillment times, and shipping costs. This targeted approach ensures each team has the information they need to make informed, data-backed decisions that contribute to overall business success.
This collaborative approach builds a data-driven environment where insights are shared, discussed, and acted upon. This leads to more informed decisions, better processes, and ultimately, improved business results.
Building a Data-Driven Culture
Creating a truly data-driven environment is crucial for long-term success. This requires more than simply having an e-commerce analytics dashboard. It means integrating data into the foundation of your business, making it a regular part of every decision.
This involves empowering employees to access and understand data, promoting data-driven discussions, and recognizing successes based on data insights. Think of your dashboard not just as a reporting tool, but as a navigation system guiding your business toward growth. Regular team meetings centered around dashboard insights, data-driven performance reviews, and incentives for data-based progress help develop a data-centric mindset.
This shift in thinking transforms data from passive observation to an active force for positive change. It allows your entire team to participate in data-driven growth.
Balancing Quantitative and Qualitative Insights
While the quantitative data from your dashboard is essential, balancing it with qualitative customer insights is key. This can include customer reviews, social media comments, and survey results. For example, your dashboard might show a high conversion rate for a specific product, but customer reviews might reveal concerns about quality or delivery.
Combining both perspectives gives you a more holistic view of customer behavior and market trends. Imagine looking at your business through two lenses: one focused on the numbers (your dashboard), the other on customer feedback. This combined view provides richer, more insightful information, allowing you to make better decisions.
This comprehensive approach offers the best of both worlds: the precision of data and the human understanding of customer perspectives. This balance is vital for creating meaningful changes that resonate with your target audience and drive real growth in the competitive UK retail market. By using these principles, you can transform your e-commerce analytics dashboard from a static reporting tool into a powerful engine for revenue generation.
Mobile-First Analytics for Real-Time Retail Decisions
In the fast-paced retail world, timing is critical. Waiting to analyze sales data until the end of the day can mean missed opportunities. This is where mobile-optimized e-commerce analytics dashboards are making a difference for retailers in the UK. Real-time data access on the go enables quick, data-driven decisions that significantly impact profits.
The Power of Real-Time Insights on the Go
Imagine a flash sale underperforming. A mobile-first dashboard lets you instantly pinpoint the problem, whether it's a technical issue, unexpected customer behavior, or ineffective marketing. This allows you to adjust in real-time, potentially rescuing the campaign and maximizing revenue. This rapid response capability is especially vital in the competitive UK market.
Mobile dashboards also let you track key metrics like sales, conversion rates, and website traffic throughout the day, from anywhere. This constant overview keeps you informed about your business's performance, enabling you to spot trends and react to changes immediately.
Implementing Responsive Dashboards: Key Considerations
Creating a mobile-first dashboard requires careful planning of how information appears on smaller screens. Prioritizing essential metrics for mobile viewing is key. Too much data can be counterproductive. Concentrate on the data points requiring immediate attention.
For example, while in-depth product performance analysis is important for desktop use, a concise view of overall sales and conversion rates is more appropriate for mobile. This focused approach provides a quick assessment of vital information without overwhelming the user. This targeted view makes data digestible and actionable on a mobile device.
Security and User Experience: Striking the Right Balance
While mobile access is crucial, security remains paramount. Implementing strong security measures, such as two-factor authentication and data encryption, protects sensitive data while enabling access on the go. This balances mobile convenience with essential data protection.
User experience is also essential. A cluttered, difficult-to-navigate mobile interface hinders decision-making, even with access to key data. Designing an intuitive mobile experience with clear visuals and easy navigation ensures a smooth, efficient dashboard experience, improving real-time decision-making. A well-designed interface allows for quick information assessment and rapid action, maximizing mobile access benefits. This focus on user experience transforms data into actionable insights, no matter your location.
Looking for a powerful, mobile-first analytics dashboard to improve your TikTok Shop sales and profitability? Explore Mergoio, a comprehensive profit tracking software designed for e-commerce sellers. Discover the power of Mergoio today!
Leave a Reply