Why Smart Retailers Rely on Analytics Dashboards

In the fiercely competitive UK ecommerce market, data-driven decisions are essential for success. Savvy online retailers understand that relying solely on intuition is no longer sufficient. Hard data is crucial for informing effective strategies. This is where the power of an ecommerce analytics dashboard becomes indispensable, transforming raw data into actionable insights. These dashboards provide a centralized hub for monitoring and understanding your online store's performance.
Think of it like navigating the London Underground. Trying to find your way without a map can be a confusing and frustrating experience. Similarly, navigating the complexities of ecommerce without a dashboard can lead to wasted resources and missed opportunities. A well-designed dashboard is your "map," providing a clear view of customer behavior, emerging trends, and operational efficiency. This clarity empowers you to make informed decisions, impacting everything from marketing investments to inventory management.
The Benefits of Using an Ecommerce Analytics Dashboard
The primary benefit of using an analytics dashboard is its ability to consolidate key metrics into easily digestible visual formats. This allows you to quickly identify areas for improvement and capitalize on emerging trends.
-
Real-Time Monitoring: Track crucial metrics like sales, conversion rates, and website traffic in real time. This enables immediate adjustments to your strategy as needed.
-
Trend Identification: Spot emerging customer behaviors and product preferences, helping you anticipate demand and stay ahead of the competition.
-
Performance Benchmarking: Compare your store's performance against industry averages and competitors. This highlights areas of strength and areas needing improvement.
-
Improved Decision Making: Ground your decisions in data, leading to more effective marketing campaigns, optimized pricing strategies, and better customer experiences.
The Growth of UK Ecommerce and the Role of Analytics
The UK ecommerce landscape is experiencing remarkable growth. Valued at $297 billion in 2024, the UK e-commerce market is projected to reach $1.48 trillion by 2033, growing at an 18.1% CAGR. Analytics dashboards play a key role in tracking this expansion, highlighting specific categories like apparel (projected at $86 billion for fashion by 2030), home appliances, and groceries. These dashboards also benchmark key performance indicators (KPIs) like Shopify's 21% market share and Amazon's 400M+ monthly UK visitors. More detailed statistics can be found here.
This incredible growth underscores the critical role of data analysis in navigating the increasingly complex ecommerce landscape. By leveraging the insights from a robust analytics dashboard, retailers can position themselves for success in this rapidly expanding market. Furthermore, these tools enable businesses to monitor evolving consumer behaviors, such as the 69% of UK shoppers who use smartphones for purchases, ensuring their strategies remain aligned with market shifts.
By embracing data visualization and analysis, smart retailers can not only survive but thrive in the dynamic world of UK ecommerce.
Essential Metrics That Drive Ecommerce Success
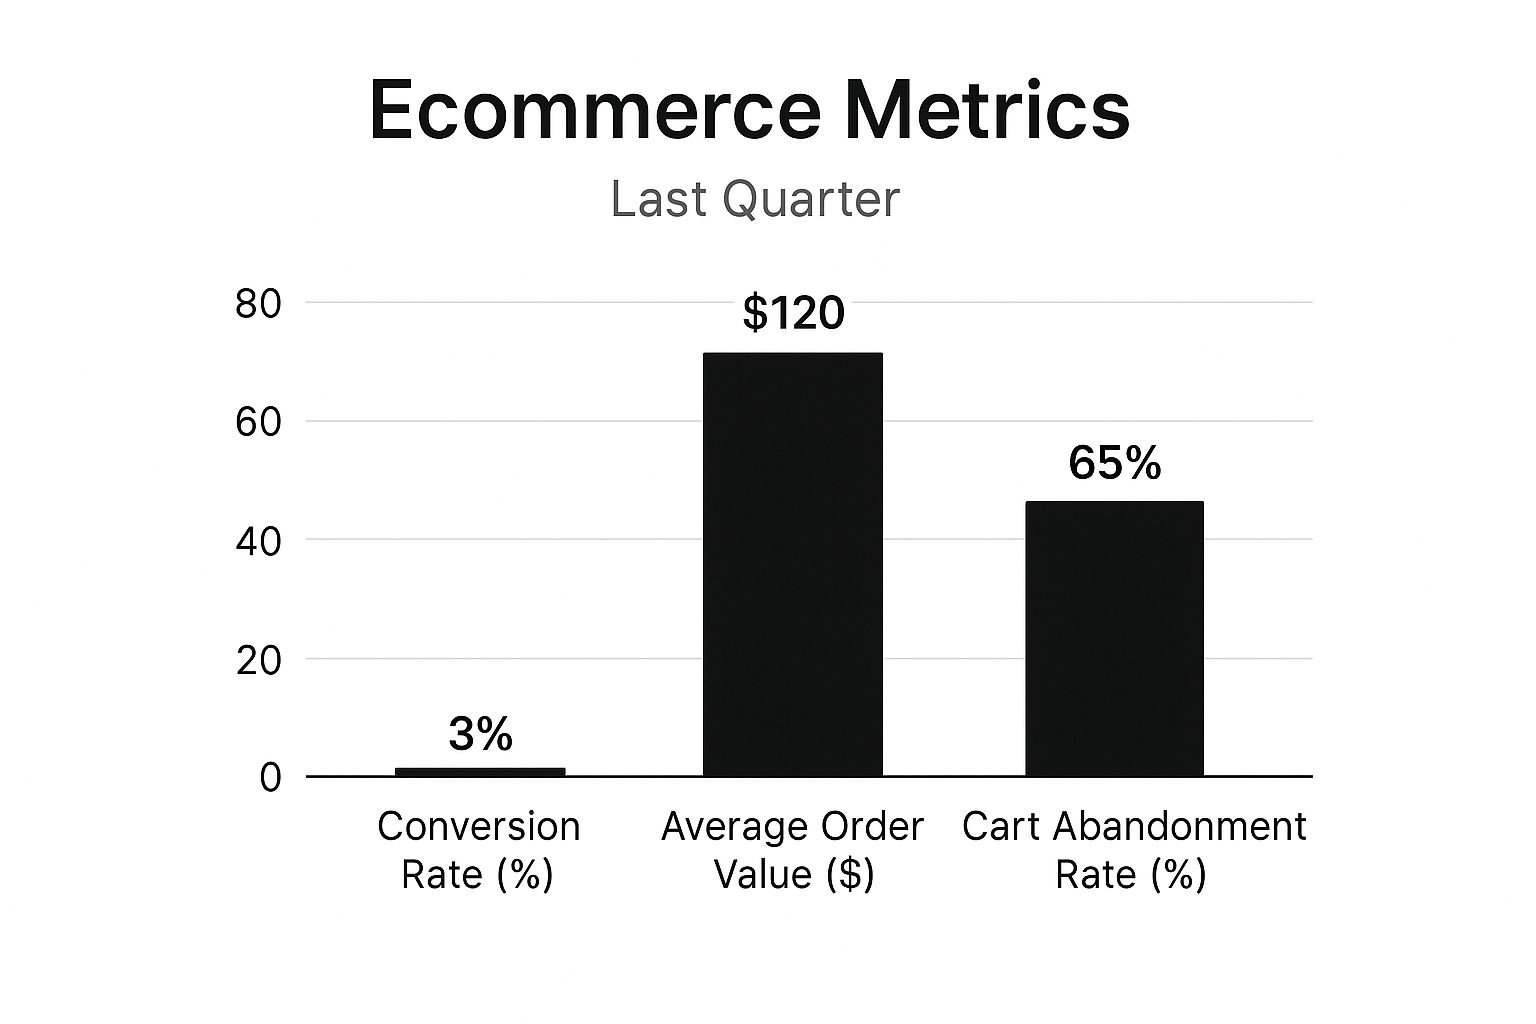
While superficial metrics might seem appealing, genuine ecommerce growth hinges on insightful data. For UK ecommerce businesses, prioritizing key performance indicators (KPIs) within your ecommerce analytics dashboard is paramount. Focus on metrics that directly influence your bottom line and offer actionable insights. The data chart above visualizes key ecommerce metrics and their impact on overall business success. You'll see clear correlations between these metrics and business growth, highlighting the importance of tracking the right data.
Key Ecommerce Metrics to Track
Think of your dashboard as the control panel for your business. Just like a car's dashboard shows vital information, your ecommerce dashboard should display the crucial metrics that keep your business running smoothly. These metrics can be categorized into core areas.
-
Sales Performance: This encompasses more than just revenue. Keep a close eye on Average Order Value (AOV), Customer Lifetime Value (CLTV), and conversion rates. A low conversion rate, for example, could indicate issues with your checkout process.
-
Customer Journey Analytics: Understanding the customer journey is essential. Identify where customers abandon the process, whether it's on the product page, in the cart, or during checkout. This highlights friction points. For example, a high cart abandonment rate might suggest problems with shipping costs or payment options. You might be interested in: How to master…
-
Marketing Effectiveness: Directly link your marketing spend to sales. Track Return on Ad Spend (ROAS) and Cost per Acquisition (CPA) for each marketing channel. This enables efficient budget allocation.
-
Inventory Intelligence: Effective inventory management is crucial. Monitor stock levels, sell-through rates, and days to sell to prevent costly stockouts and overstocking.
To help you understand how to categorize and visualize these metrics, let's look at a detailed comparison table:
The following table outlines key metrics that should be included in your ecommerce analytics dashboard, categorized by business function with recommended visualization types.
Essential Ecommerce Analytics Dashboard Metrics
| Metric Category | Key Metrics | Business Impact | Ideal Dashboard Visualization |
|---|---|---|---|
| Sales Performance | Average Order Value (AOV), Customer Lifetime Value (CLTV), Conversion Rate | Tracks revenue generation and customer profitability | Line graph for trends, bar chart for comparisons |
| Customer Journey Analytics | Cart Abandonment Rate, Bounce Rate, Time on Site | Identifies friction points in the customer journey | Funnel chart for journey progression, heatmap for user behavior |
| Marketing Effectiveness | Return on Ad Spend (ROAS), Cost per Acquisition (CPA) | Measures the success of marketing campaigns | Bar chart for channel comparison, scatter plot for ROI analysis |
| Inventory Intelligence | Stock Levels, Sell-Through Rate, Days to Sell | Optimizes inventory management and prevents stockouts | Line graph for stock levels, bar chart for sell-through rate |
This table provides a clear overview of how different metrics contribute to various aspects of your ecommerce business. By incorporating these metrics into your dashboard and using the suggested visualizations, you can gain valuable insights into your performance.
Visualizing Your Data: The Power of Charts
An effective ecommerce analytics dashboard utilizes visualizations to highlight key trends. A bar chart comparing monthly sales can quickly reveal seasonal buying patterns. A pie chart can show the proportion of sales from different marketing channels.
Example Data for Chart (Bar Chart):
| Metric | Q1 2025 | Q2 2025 | Q3 2025 |
|---|---|---|---|
| Conversion Rate | 2% | 2.5% | 3% |
| Average Order Value (£) | £50 | £55 | £60 |
| Customer Lifetime Value (£) | £200 | £220 | £250 |
This bar chart clearly illustrates a positive growth trend across these three key metrics over time, indicating that optimization efforts are yielding positive results. Analytics dashboards for UK e-commerce provide crucial benchmarks, such as transaction values and retailer rankings. For example, Amazon dominates with 400M+ monthly UK visitors (2024), followed by eBay with 200M. Shopify powers 21% of the market, serving 200,000+ UK stores. Dashboards also track average online spending per shopper ($4,679) and apparel sales (30M+ users), along with real-time metrics like conversion rates and cart abandonment. The Knight Frank Retail Sales Dashboard offers monthly snapshots of e-commerce performance across various sub-sectors, while ECDB's whitepaper offers rankings for top payment and shipping providers. These tools enable businesses to optimize logistics, refine marketing campaigns, and analyze device preferences (e.g., 69% mobile purchases), ensuring agility in a market projected to grow fivefold by 2033. Find more detailed statistics here. Understanding these benchmarks and leveraging data visualizations provides a significant competitive advantage in the UK market.
Designing Dashboards That Actually Drive Decisions

An aesthetically pleasing ecommerce analytics dashboard is useless if it doesn't encourage action. It's like a beautifully designed car without an engine – visually appealing but ultimately ineffective. This section explores the principles that transform data displays into powerful decision-making tools for UK retailers. We'll examine why so many dashboards fail to inspire action and how successful merchants organize their analytics to uncover immediate insights.
Avoiding Dashboard Design Pitfalls
Many dashboards become cluttered with excessive data, burying vital information in a sea of numbers. This often occurs when businesses attempt to track every possible metric without prioritizing key information. The result is similar to navigating a disorganized store – you struggle to find what you need and leave frustrated. Successful dashboards, however, prioritize clarity and focus, presenting only the most essential data.
-
Information Overload: Don't overload your dashboard with too much data. Concentrate on key performance indicators (KPIs) that align with your specific business objectives.
-
Lack of Context: Numbers without context lack meaning. Provide benchmarks and comparisons to help interpret performance trends effectively.
-
Poor Visualizations: Select the appropriate chart type for your data. A line graph effectively displays trends, whereas a pie chart is best suited for illustrating proportions.
-
Infrequent Use: A dashboard is valuable only if it's used consistently. Implement a regular schedule for reviewing your dashboard and acting on the insights gained.
Designing for Actionable Insights
Effective dashboards guide users towards specific actions. This involves presenting data in a way that prompts clear next steps. For instance, if a sudden drop in conversion rates is highlighted, this should immediately trigger an investigation into the checkout process. This proactive approach transforms data into tangible improvements.
Key Dashboard Design Principles for UK Retailers
A well-designed dashboard functions like a well-organized shop. It guides customers efficiently toward what they need. By implementing these principles, you can significantly enhance the effectiveness of your ecommerce analytics dashboard.
-
Prioritize Key Metrics: Focus on the metrics directly influencing your bottom line, such as conversion rate, average order value, and customer acquisition cost.
-
Use Clear Visualizations: Opt for chart types that clearly communicate the data, avoiding complex or confusing displays. Line graphs, bar charts, and pie charts are often effective.
-
Provide Context: Include benchmarks and comparisons to understand your performance relative to industry averages or prior periods. This added context clarifies the significance of changes in your metrics.
-
Mobile Optimization: Given the high number of UK consumers using mobile devices for shopping, ensure your dashboard is easily accessible and readable on mobile devices. This allows for convenient business monitoring on the go.
-
Regular Review and Action: Schedule regular dashboard reviews with your team to discuss insights and formulate action plans. This ensures data translates into concrete steps for improvement.
By adhering to these principles and avoiding common pitfalls, you can transform your ecommerce analytics dashboard into a powerful tool. It will drive decisions and help achieve your business goals within the competitive UK market. This proactive approach to data analysis can significantly impact your profits. It allows your business to shift from passively observing trends to actively shaping its future.
Choosing the Right Dashboard Tools for Your Store
Finding the perfect ecommerce analytics dashboard can feel overwhelming. With countless options available, it's easy to get lost. This guide offers practical advice for UK retailers, evaluating dashboards based on their actual performance. We'll explore various solutions, from established platforms like Adobe Analytics to more specialized tools and native platform options.
Key Considerations for UK Businesses
Choosing an ecommerce analytics dashboard requires careful planning. Your dashboard should integrate smoothly with your current setup, including your ecommerce platform, payment gateways, and marketing tools. This ensures efficient data flow and reduces manual work.
UK-Specific Needs
Several factors are especially important for UK businesses:
-
Integration with UK Payment Systems: Ensure compatibility with popular UK payment gateways like Stripe, PayPal, and Worldpay. This enables complete transaction tracking. For instance, incomplete transactions may highlight issues with specific payment methods.
-
VAT Reporting: VAT reporting is critical for UK businesses. Choose a dashboard that simplifies this by automatically calculating and reporting VAT on sales, streamlining accounting and ensuring compliance.
-
Regional Marketplace Integration: If you sell on UK marketplaces like OnBuy or Flubit, check for dashboard integration to get a complete view of your sales across all channels.
-
Data Security and GDPR Compliance: Data privacy is essential. Choose a provider that prioritizes security and complies with GDPR regulations, protecting customer data and ensuring legal operation.
Comparing Popular Dashboard Solutions
To help you assess your options, we've compiled a comparison table of popular ecommerce analytics dashboards, emphasizing key features and factors for UK retailers.
To help you compare available solutions, we've compiled the following table:
Comparing Top Ecommerce Analytics Dashboard Platforms
| Platform | Best For | Key Features | UK-Specific Capabilities | Price Range | Integration Options |
|---|---|---|---|---|---|
| Google Analytics | Small to medium-sized businesses | Website traffic analysis, conversion tracking, audience demographics | Basic ecommerce tracking, limited UK-specific features | Free | Integrates with various marketing platforms |
| Adobe Analytics | Large enterprises | Advanced analytics, custom reporting, predictive modeling | Robust data analysis capabilities, potential for UK-specific customizations | High-end, tailored pricing | Extensive integration options |
| Glew.io | Medium to large ecommerce businesses | Customer cohort analysis, inventory forecasting, marketing ROI tracking | Potential for custom integrations with UK systems | Mid-range, scalable pricing | Integrates with popular ecommerce platforms |
| Shopify Analytics | Shopify users | Sales reporting, customer behavior analysis, product performance tracking | Built-in UK VAT reporting, integrates with Shopify POS | Included with Shopify plans | Seamless integration with the Shopify ecosystem |
This table offers a starting point. Research each platform further based on your needs, considering budget, technical expertise, and the data you need to track. Check out our guide on How to master… for more details.
Learning From UK Merchants
Learning from other UK retailers is invaluable. Many regret not fully understanding their needs before choosing a dashboard, leading to either overly complex, underutilized systems or solutions that lack the necessary depth for growth. A small business might initially need basic traffic and sales data, while a larger enterprise requires more advanced analytics for customer segmentation and predictive modeling.
Choosing Wisely for Long-Term Success
The right ecommerce analytics dashboard is a vital investment. By considering your business needs, evaluating platforms, and learning from others, you can find the perfect tool to support your growth. This allows you to move past basic metrics and use your data's full potential to improve operations, identify areas for optimization, and drive significant revenue growth in the UK market.
Beyond Basic Metrics: Advanced Analytics That Drive Growth

Mastering basic ecommerce metrics is just the first step. To truly excel against the competition, leading UK retailers are using advanced analytics within their ecommerce analytics dashboards. This goes beyond simply tracking what happened to understanding why it happened, and even predicting future trends. Think of it this way: basic metrics tell you the final score, while advanced analytics reveal the game plan and individual player contributions that determined the outcome.
Predictive Analytics: Anticipating the Future
Predictive analytics uses historical data to forecast upcoming trends. This is especially powerful for inventory management. By analyzing past sales data along with external factors like holidays or weather, businesses can accurately predict future demand. This helps minimize the risks of stockouts or excess inventory, directly impacting profitability. For example, a UK retailer could anticipate a surge in umbrella sales during the typically wet autumn months.
Cohort Analysis: Understanding Customer Segments
Cohort analysis groups customers with shared characteristics, such as acquisition date or initial purchase. This allows businesses to understand the long-term behavior of different customer segments. This is particularly useful for calculating customer lifetime value (CLTV). By identifying the customer segments with the highest CLTV, marketing efforts can be refined and spending optimized for maximum impact.
Automated Alerts: Staying Ahead of the Curve
Imagine your ecommerce analytics dashboard as a dedicated monitor, constantly tracking your store's performance. Automated alerts enhance this monitoring by immediately notifying you of unusual activity. For instance, a sudden dip in conversion rates or a rise in abandoned carts can trigger an alert, enabling swift investigation and corrective action before profits are significantly affected.
A/B Testing: Data-Driven Optimization
A/B testing, especially when incorporated directly within your dashboard, allows you to test different versions of website elements like headlines or button colors, and instantly see the impact on key metrics. This direct link between testing and revenue streamlines data-driven optimization. A UK retailer might A/B test various calls to action on product pages to determine which version yields the most sales. When considering tools for your store, consider integrating live chat with your ecommerce platform, such as BigCommerce Live Chat.
Implementing Advanced Analytics: A Step-by-Step Guide
Implementing advanced analytics may appear complex, but it can be approached strategically. Start by defining your primary business goals. Is the focus on improving customer retention, optimizing marketing spend, or streamlining inventory management? After identifying those objectives, you can select the most relevant advanced analytics techniques and an ecommerce analytics dashboard with the necessary features. For further guidance, see our article about How to master…. By implementing these strategies incrementally, even smaller businesses can use advanced analytics to drive substantial growth in the UK market.
Turning Dashboard Insights Into Revenue Growth
Having a robust ecommerce analytics dashboard is a crucial first step, but it's only half the journey. The real power lies in translating the data into tangible revenue growth for your UK business. This means actively using the insights to shape your strategies and improve performance, not just passively observing the numbers. This section will explore how successful retailers use these frameworks to make data-driven decisions that positively impact their bottom line.
Effective Dashboard Review Methodologies
Regularly reviewing your ecommerce analytics dashboard should be a collaborative effort. Gather key stakeholders from various departments, including marketing, sales, product development, and customer service. Each team brings a unique perspective, allowing for a richer analysis and uncovering opportunities that might be missed in a siloed approach. For instance, customer service insights might reveal recurring product issues that are impacting sales, providing valuable information for the product development team.
Key questions to guide your dashboard reviews:
- What are the most significant changes in key metrics since the last review?
- What factors might be contributing to these changes?
- What actionable steps can we take to capitalize on positive trends or address negative ones?
- Who is responsible for implementing these actions?
- What is the implementation timeline?
Documenting these action plans and assigning clear ownership is vital for accountability and follow-through.
Prioritizing Actions: Urgent vs. Incremental
Not every insight demands immediate action. It’s important to distinguish between urgent issues, such as a sudden drop in conversion rates, and opportunities for incremental improvement, like a small increase in average order value. Addressing urgent issues should always take precedence. This is similar to managing your finances – you wouldn't put off paying overdue bills to explore long-term investment opportunities.
Communicating Data Stories: Tailoring Your Message
How you communicate data insights is just as important as the data itself. Tailor your message to the specific audience. A marketing team may be interested in the performance of individual campaigns, while executive leadership will likely focus on overall revenue growth and return on investment (ROI). Presenting clear, concise, and audience-specific data narratives ensures the message resonates and motivates action.
Case Studies: UK Ecommerce Success Stories
Many UK ecommerce businesses have seen significant revenue growth by using data-driven decisions based on dashboard insights. One retailer, for example, expanded their product line after analyzing search patterns on their online store. Another optimized their marketing campaigns based on ROI data, leading to dramatically improved results. These examples demonstrate the tangible impact of turning data into action.
Evolving Your Analytics Approach
Your analytics approach should evolve alongside your business. Start with the most essential metrics and gradually integrate more advanced analytics as your needs change and grow. This ensures you’re always maximizing the potential of your data to drive growth and remain competitive in the UK market.
Ready to turn your TikTok Shop data into profit? Mergoio offers real-time analytics and a customizable dashboard designed specifically for TikTok sellers, with Amazon integration coming soon. Gain valuable insights into your sales, understand key trends, and forecast costs accurately. Join our beta program today and experience the power of data-driven decisions. Visit Mergoio to learn more and sign up.
Leave a Reply