The Strategic Power of Product Performance Analysis

In the competitive UK market, data-driven decisions are essential for business success. Product performance analysis helps businesses transition from relying on intuition to developing strategies based on concrete evidence. By analyzing product performance systematically, businesses can uncover hidden growth opportunities and avoid costly missteps, ultimately leading to measurable improvements.
Why Product Performance Analysis Matters
Product performance analysis offers valuable insights into customer interactions with your products. This understanding is crucial for tailoring products to meet the specific needs and preferences of your target audience.
Furthermore, this analysis helps optimize various aspects of your business, including pricing strategies, marketing campaigns, and product development roadmaps. For instance, analysis might reveal that a specific feature isn't resonating with users. This could lead to a redesign or even removal of the feature to improve the overall product experience.
This data-driven approach ensures effective resource allocation, maximizing your return on investment.
Product performance analysis in the UK is closely linked to the overall economic output. The Index of Production, which measures the output of production industries, experienced a decrease of 0.9% in January 2025. This followed a 0.5% increase in December 2024 and highlights the fluctuating nature of the UK's industrial sector.
The 74.5% response rate for the Monthly Business Survey (MBS) in January 2025 indicates significant data coverage. This data is crucial for companies analyzing their production performance and adjusting strategies accordingly. The production sectors covered include manufacturing, mining and quarrying, electricity, gas, water supply, and construction. Understanding these trends empowers businesses to make informed decisions about production and investment in the UK market. More detailed statistics can be found here: Index of Production, January 2025
Key Product Performance Metrics
Understanding product performance requires tracking a range of metrics. The following table provides a comprehensive overview of these essential metrics, categorized for clarity.
To gain a thorough understanding of product performance, it's essential to track various metrics. The table below, "Key Product Performance Metrics," offers a breakdown of these vital measurements.
| Metric Category | Specific Metrics | What They Measure | Ideal Frequency |
|---|---|---|---|
| Financial Performance | Revenue, Profit Margin, Return on Investment (ROI) | Overall financial success of the product | Monthly/Quarterly |
| Customer Engagement | Customer Satisfaction (CSAT), Net Promoter Score (NPS), Customer Retention Rate | How customers interact with and perceive the product | Ongoing/Regular surveys |
| Market Share | Market Penetration, Customer Acquisition Cost (CAC) | Product's position within the market | Quarterly/Annually |
| Operational Efficiency | Production Costs, Delivery Times, Defect Rates | Effectiveness of product creation and delivery processes | Continuously monitored |
This table categorizes key metrics, explains what they measure, and suggests ideal tracking frequencies, providing a framework for comprehensive performance analysis.
Turning Insights into Action
Collecting data is only the first step. The real value of product performance analysis lies in using these insights to inform strategic business decisions. This involves identifying patterns, understanding causal relationships, and effectively communicating findings to stakeholders.
Businesses must develop the ability to not just analyze data, but to act upon it decisively. For example, if analysis reveals declining customer satisfaction, businesses can investigate the root cause and implement targeted solutions.
This might involve improving customer service, refining product features, or adjusting marketing messages. This iterative process of analysis, action, and further analysis promotes continuous improvement. It also helps ensure products remain competitive and aligned with evolving customer needs.
Mastering product performance analysis allows UK businesses to make well-informed decisions, optimize product offerings, and achieve sustainable growth in a dynamic market.
The Metrics That Actually Drive Product Decisions
Stop drowning in vanity metrics and focus on what genuinely impacts your bottom line. For UK businesses, understanding which key performance indicators (KPIs) truly matter is paramount to success. This means going beyond surface-level sales figures and diving deep into the metrics that reveal the full story of your product's performance.
Financial Metrics: Beyond the Surface
While revenue is important, it doesn’t tell the whole story. Profit margin, revealing the profitability of each sale, is crucial.
Additionally, Return on Investment (ROI) demonstrates the overall financial success of your product. For example, if you invest £10,000 in marketing a product and generate £20,000 in profit, your ROI is 100%.
Tracking these financial metrics monthly or quarterly provides a clear picture of your financial health.
Customer Engagement: Predicting Long-Term Loyalty
Understanding how customers interact with your product is essential for building long-term loyalty. Customer Satisfaction (CSAT) scores, obtained through regular surveys, directly measure customer happiness.
Net Promoter Score (NPS) gauges how likely customers are to recommend your product, providing valuable insights into customer loyalty. Finally, Customer Retention Rate reveals how many customers continue using your product over time, highlighting long-term value.
Operational Metrics: Exposing Hidden Inefficiencies
Operational efficiency directly impacts your bottom line. Tracking production costs, delivery times, and defect rates can expose inefficiencies eating into your margins.
This means that by streamlining operations, you can not only improve customer satisfaction but also boost profitability. For example, reducing delivery times by 10% could significantly improve customer experience and reduce logistical costs.
These metrics should be continuously monitored to ensure optimal performance.
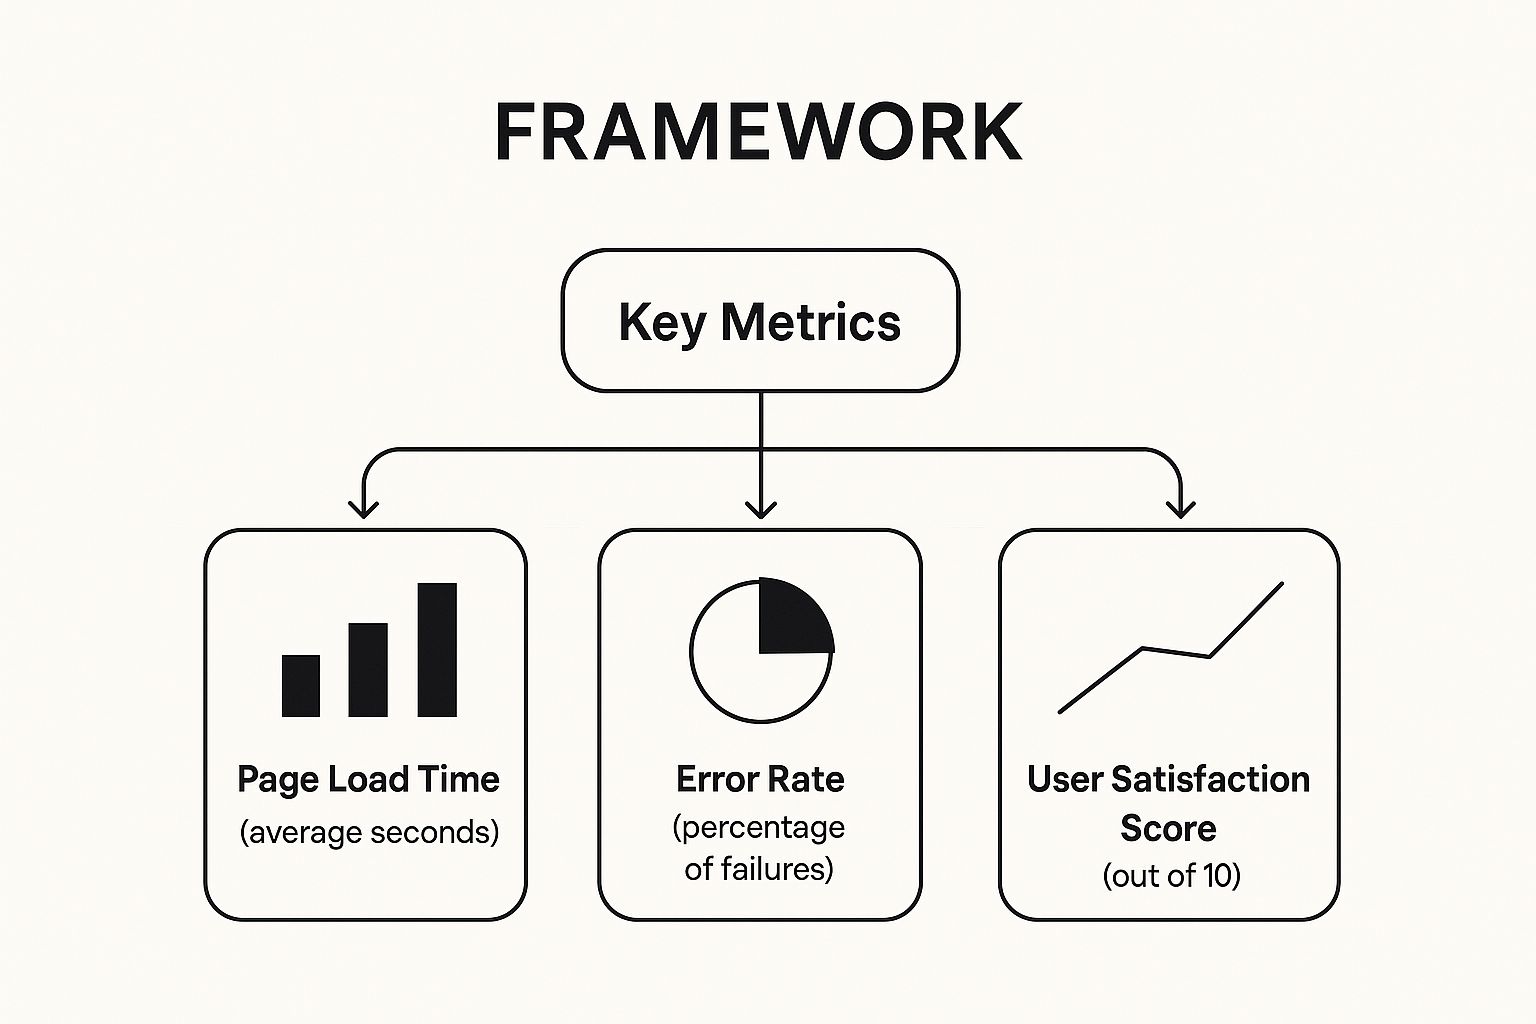
The infographic above visualizes the interconnectedness of three key performance metrics: Page Load Time, Error Rate, and User Satisfaction Score. As the visualization demonstrates, these metrics are crucial for understanding the overall user experience.
Slow page load times and high error rates directly correlate with lower user satisfaction scores, highlighting the importance of optimizing these technical aspects. This interconnectedness emphasizes the need for a holistic approach to product performance analysis.
To help structure your analysis, consider the following framework:
The table below, "Product Performance Analysis Framework," provides a structured approach to analyzing product performance across different dimensions. It outlines key questions to ask, the data sources you'll need, and common pitfalls to avoid.
| Analysis Dimension | Key Questions | Required Data Sources | Common Pitfalls |
|---|---|---|---|
| Financial Performance | What is the product's profit margin? What is the ROI? | Sales data, marketing spend, production costs | Focusing solely on revenue and ignoring profitability. |
| Customer Engagement | What is the CSAT score? What is the NPS? What is the customer retention rate? | Customer surveys, feedback forms, product usage data | Not regularly collecting customer feedback. |
| Operational Efficiency | What are the production costs? What are the delivery times? What are the defect rates? | Internal tracking systems, logistics data | Failing to identify and address inefficiencies. |
This framework helps businesses identify areas for improvement and make data-driven decisions to optimize product performance. By considering these dimensions, companies can gain a comprehensive understanding of their product's strengths and weaknesses.
Choosing the Right Metrics for Your Product
The ideal metrics for your product depend on various factors, including its lifecycle stage, competitive positioning, and strategic objectives. A new product might prioritize user acquisition metrics, while a mature product might focus on retention and profitability.
Similarly, a product in a highly competitive market might track market share closely. Mergoio, a profit tracking software designed for TikTok Shop sellers (with future Amazon integration), empowers users to analyze these vital metrics.
Its customizable dashboard allows sellers to focus on the data most relevant to their business, providing actionable insights to optimize operational efficiency and boost profitability. Learn more about how Mergoio can help your business thrive in the competitive e-commerce landscape: Mergoio – Profit Tracking for TikTok Shop
By carefully selecting and tracking the right metrics, UK businesses can make data-driven decisions, optimize their products, and achieve sustainable growth. This targeted approach transforms product performance analysis from a passive reporting exercise into a powerful engine for strategic decision-making. This empowers businesses to not only react to market changes but to anticipate and shape them.
Building Data Collection Systems That Deliver Insights

Effective product performance analysis hinges on the quality of your data. For UK businesses, this translates to the need for robust data collection systems that capture a complete picture of product performance. Building such a system involves several key components, from automated tracking to customer feedback mechanisms, all working in concert to provide actionable insights.
Automated Tracking Systems: Eliminating Human Error
Automated tracking systems are crucial for collecting accurate and consistent data. By minimizing human error, these systems ensure reliable data capture across all touchpoints. This encompasses various data streams including website analytics, in-app tracking, and point-of-sale data.
For example, automated systems can track metrics like page views, conversion rates, and customer purchase history without any manual intervention. This not only ensures data integrity but also provides a solid foundation for subsequent analysis. Moreover, automation frees up valuable analyst time, allowing them to focus on interpreting the data and extracting meaningful insights.
Customer Feedback Mechanisms: Generating Actionable Insights
While automated tracking provides valuable quantitative data, customer feedback offers essential qualitative insights into product performance. This feedback helps businesses understand why certain metrics behave in specific ways. Effective feedback mechanisms include surveys, customer reviews, and social media monitoring.
By actively soliciting and analyzing customer feedback, businesses can pinpoint areas for improvement, address customer pain points, and ultimately boost customer satisfaction. For instance, negative reviews could highlight usability issues, prompting a product redesign. These insights can then inform product development roadmaps and lead to a better user experience.
Competitive Intelligence: Understanding the Market Context
Analyzing product performance in isolation is rarely effective. It’s essential to consider the broader market context. Competitive intelligence gathering allows businesses to benchmark their products against competitors, identify emerging industry trends, and uncover new market opportunities. This includes monitoring competitor pricing, product features, and marketing campaigns.
Understanding the competitive landscape provides vital context for interpreting product performance data. For example, declining sales might not indicate a poor product but could be a result of aggressive competitor pricing. This knowledge can then inform strategic decisions related to pricing and product positioning. Furthermore, staying abreast of broader market trends is crucial. In the UK, the services sector plays a significant role in the economy. The Index of Services saw a 0.1% increase in January 2025, reflecting stable growth in sectors like finance, retail, and hospitality. This growth directly impacts how products are marketed and sold in the UK. You can learn more here: Index of Services, January 2025
Integrating Data Sources and Ensuring Data Quality
Effective product performance analysis requires integrating data from diverse sources into a unified view. This means connecting website analytics, customer feedback data, competitive intelligence, and other relevant sources into a central dashboard.
However, simply collecting data isn't sufficient. Data quality is paramount. Businesses must implement robust data validation processes to ensure accuracy and consistency across all data points. This includes regular data audits and cleaning procedures. Without accurate data, even the most sophisticated analysis can lead to flawed conclusions and ineffective strategies. By prioritizing data quality, UK businesses can confidently rely on their data-driven insights to make informed product decisions. Integrating these diverse data streams unlocks a holistic understanding of the factors impacting product performance.
Mastering Competitive Intelligence for Market Advantage
Analyzing product performance requires more than just an internal review; it demands understanding your place in the broader market. This involves delving into competitive intelligence, a process that benchmarks your products, identifies opportunities, and anticipates industry shifts. For UK businesses, this skill is crucial for maintaining a competitive edge.
Benchmarking Your Products Against Competitors
Effective competitive analysis goes beyond casual observation. It requires a systematic approach to benchmarking your products against competitors, identifying key differences in features, pricing, and marketing. This helps pinpoint your product's strengths and weaknesses relative to the competition.
For instance, discovering a competitor offering a similar product at a lower price can inform your pricing strategy and help you stay competitive. This data-driven approach enables strategic responses to market changes, rather than simply reacting to competitors.
Identifying Untapped Market Opportunities
Competitive intelligence can also uncover hidden opportunities. By analyzing competitor performance and identifying gaps in their offerings, you can find potential areas for innovation and growth. This might involve developing new features, targeting underserved customer segments, or expanding into new regions.
This proactive market analysis can unlock significant growth and position your brand as an innovator. It's about anticipating future market needs and positioning your products accordingly, before the competition does.
Anticipating Industry Shifts and Regional Variations
The UK market is dynamic, with regional nuances that influence product adoption. Tracking these variations is vital for understanding product performance across different areas. Staying ahead of broader industry shifts is also crucial. The UK internal market plays a vital role in product performance analysis, facilitating free trade across regions.
The Office of the Internal Market (OIM) emphasizes this unified market's importance for efficient business operations. This framework allows companies to compare performance across regions and adapt strategies accordingly. For more detailed information, refer to the OIM Annual Report.
Monitoring market trends and competitor activity allows you to anticipate disruptions and adapt proactively, minimizing risks and capitalizing on emerging opportunities.
Turning Intelligence into Actionable Improvements
The true value of competitive intelligence lies in its ability to inform product improvements. This involves translating market insights into tangible actions that enhance product performance.
This could involve refining existing features, developing new functionalities, or adjusting your marketing message to better resonate with your audience. Consistently implementing performance-driven improvements creates genuine product differentiation and strengthens your market position, allowing UK businesses to move beyond reactive strategies and embrace proactive innovation.
Transforming Data Into Strategic Business Decisions

Data-driven insights are invaluable for any business, but only if they lead to concrete action. This section explores how product leaders in the UK translate product performance analysis into strategic decisions that drive meaningful change. This involves moving beyond simply observing trends and delving into the reasons behind the numbers.
Distinguishing Patterns From Noise
Effective product performance analysis requires separating meaningful patterns from statistical noise. This demands a strong understanding of your target market and the ability to identify trends that genuinely affect your product’s performance. For instance, a temporary spike in sales might be due to a short-term promotional campaign rather than reflecting a sustainable upward trend.
Businesses must develop the skills to critically evaluate data and avoid basing decisions on temporary fluctuations. Instead, focus on identifying sustained patterns that indicate real changes in consumer behavior or market dynamics.
Uncovering Causal Relationships
Understanding the distinction between correlation and causation is crucial. Just because two metrics move in tandem doesn't mean one directly influences the other. For example, increased website traffic might correlate with higher sales, but the traffic might not be the direct cause of the increased sales.
Deeper analysis could reveal that a targeted marketing campaign drives both the traffic and sales increases. This underscores the importance of root cause analysis to identify the true drivers of product performance. Discovering these causal relationships leads to more effective decision-making by identifying the factors that genuinely influence your bottom line.
Communicating Findings Effectively
Data-driven insights are only as valuable as your ability to communicate them clearly. Different stakeholders require different levels of detail and varying communication styles. Executive teams may need a high-level summary of key trends, while product teams need more granular data to inform specific product improvements.
This means adapting your communication to resonate with each audience. Use clear visuals, such as charts and graphs created with tools like Google Charts, to instantly highlight key performance indicators. Frame your findings within the context of the business's strategic goals to demonstrate the relevance of your analysis. Transform complex data into compelling business cases for product improvements using concise and persuasive language.
Visualization, Root Cause Analysis, and Presentation
Effective visualization is essential for highlighting critical performance issues quickly. Tools like heatmaps can visually represent user behavior on your website or app, instantly revealing areas of friction or high engagement. This lets you immediately pinpoint problem areas and prioritize improvements.
Once problems are identified, root cause analysis methods, such as the "5 Whys" technique, can help uncover the underlying reasons for performance bottlenecks. This systematic approach to problem-solving helps businesses address the root causes of issues, not just the symptoms.
Finally, presenting your findings effectively is crucial to gain support for product improvements. Frameworks like the problem-solution-benefit approach help structure your arguments by clearly outlining the problem, the proposed solution, and the anticipated benefits to the business. This allows you to present complex data in a compelling and persuasive way, securing the resources and support needed for data-driven changes.
By mastering these techniques, UK businesses can transform data from a passive reporting exercise into a powerful driver of strategic decision-making. This empowers companies to not just react to market trends but proactively shape their products for success in the competitive UK landscape. Just as Mergoio, profit tracking software for TikTok Shop sellers, provides data-driven insights to optimize their businesses, so too can these techniques empower your business to leverage product performance analysis for strategic advantage. Discover how Mergoio can help your business.
Implementing Product Improvements That Deliver Results
Product performance analysis isn't simply about collecting data; it's about leveraging that data to create meaningful improvements. For UK businesses, this means translating insights into actions that yield tangible results. This process involves prioritizing changes, testing effectively, and managing implementation across various teams.
Prioritizing High-Impact Changes
Not all product improvements are equal. Some offer substantial returns, while others provide minimal impact. Prioritization is key. Focus on the changes that address the most critical performance bottlenecks identified during product performance analysis.
For example, if analysis reveals a slow checkout process leading to high cart abandonment rates, improving the checkout experience should be a top priority. This focused approach ensures resources are allocated effectively to maximize impact. Consider using a prioritization matrix to rank potential improvements based on potential impact and ease of implementation. This helps identify the "quick wins" that deliver substantial value rapidly.
Testing Changes Before Full Rollout
Thorough testing is crucial before implementing changes across your entire product. This mitigates risks and allows for fine-tuning based on real-world feedback. A/B testing is a powerful technique for comparing different versions of a feature or design element. Optimizely is a popular platform for A/B testing.
This controlled experimentation measures the impact of different variations on key performance indicators. For instance, A/B test two different checkout page designs to see which version leads to higher conversion rates. Data on user behavior and preferences helps inform data-driven decisions.
Managing Cross-Functional Implementation
Product improvements often require collaboration across multiple teams, including engineering, design, marketing, and customer support. Effective communication and coordination are essential.
Clearly defined roles and responsibilities ensure everyone understands their contributions. Regular progress updates and open communication channels keep all teams aligned and informed. This collaborative approach streamlines the implementation process and reduces friction.
Overcoming Organizational Resistance
Change can be challenging. Resistance to product modifications can arise within an organization. Proactively addressing this resistance is vital.
Clearly communicating the rationale behind proposed improvements, highlighting the benefits to both customers and the business, and involving stakeholders in the decision-making process can help overcome resistance. Data supporting the need for change provides a compelling argument. For example, presenting data on improved conversion rates or increased customer satisfaction demonstrates tangible value.
Agile Approaches and Governance Frameworks
Agile methodologies enable rapid responses to performance insights. Iteratively developing and testing improvements allows for quick adaptation to changing market conditions and customer needs.
This flexibility allows for adjustments throughout the implementation process, ensuring alignment with business objectives. However, agility must be balanced with effective governance. Clear governance frameworks ensure product improvements align with overall business strategy and comply with relevant regulations.
Measuring the ROI of Your Initiatives
The final step is measuring the impact of your product improvements on key performance indicators. This involves tracking changes in metrics such as conversion rates, customer satisfaction scores, and revenue growth. Quantifying the return on investment (ROI) demonstrates the value of product performance analysis.
This data-driven approach justifies the investment in analysis and improvement efforts, building support for continued optimization. Mergoio offers detailed profit tracking, empowering TikTok Shop sellers to measure the ROI of their business decisions. This detailed data empowers sellers to make informed decisions and improve operational efficiency.
Want to enhance your business decision-making? Discover how Mergoio can help your business grow.
Leave a Reply