
Why Your Ecommerce Business Needs a KPI Dashboard
Operating an ecommerce business in the UK without an ecommerce KPI dashboard is like trying to find your way through a bustling city without a map. While you might eventually get to your destination, the journey will likely be filled with wrong turns and wasted time. An ecommerce KPI dashboard acts as your navigational guide, providing essential real-time data to make informed decisions. This data translates directly into improved profits.
Imagine having immediate insight into which marketing campaigns are generating the most conversions. Or knowing which products are selling fastest, in real-time. This is the power a robust KPI dashboard provides.
This data-driven approach is essential in the ever-changing UK retail landscape. For instance, picture a sudden spike in demand for a specific product. A real-time dashboard allows you to instantly recognize this trend and capitalize on it. You can quickly adjust stock levels, increase product promotion, and ensure smooth logistics.
Conversely, any dip in performance can be quickly identified and addressed before it becomes a significant issue. This proactive strategy maximizes opportunities and minimizes potential risks. This is especially important considering the anticipated growth of the UK ecommerce market.
The UK ecommerce market is predicted to hit $335.3 billion in 2024, with a projected annual growth rate of 7.32%. This growth is expected to continue, with a compound annual growth rate (CAGR) of 6.36% from 2024 to 2028, reaching a projected market size of $429.1 billion by 2028. This highlights the need for operational efficiency and informed decision-making. For more detailed statistics, see this report: United Kingdom Ecommerce Market Opportunities.
Benefits of Using an Ecommerce KPI Dashboard
A centralized ecommerce KPI dashboard ensures all teams within your business access the same up-to-the-minute data. This shared understanding of performance promotes collaboration. Marketing teams can align campaigns with real-time sales figures, and operations teams can accurately anticipate demand and optimize logistics. This synergy is crucial for achieving business goals.
Furthermore, data visualization within dashboards simplifies complex data. Key metrics are presented clearly and concisely, often using easy-to-interpret graphs and charts. This eliminates the need to wade through endless spreadsheets. Trends and patterns become easily identifiable, allowing for faster and more agile decisions. In the fast-paced ecommerce world, minimizing decision latency can be a key competitive advantage.
From Reactive to Proactive: The Power of Real-Time Data
Ecommerce KPI dashboards enable a shift from reactive to proactive management. Instead of reacting to problems after they occur, you can anticipate and address potential issues in advance. This proactive approach not only reduces costs but also improves customer satisfaction, ultimately fueling business growth.
Think of it as preventative maintenance for your business. Addressing a small problem early on is far more cost-effective than dealing with a major crisis later. An ecommerce KPI dashboard provides a comprehensive view of your business performance, making it a vital tool for strategic decision-making and sustainable growth in the competitive UK retail market. It empowers you to make informed choices, optimize operations, and stay ahead of the competition.
Essential KPIs Every Ecommerce Dashboard Needs
An effective ecommerce KPI dashboard offers a powerful tool for understanding your business's performance and pinpointing areas for improvement. Just as vital signs inform medical diagnoses, KPIs help UK retailers diagnose and enhance their business strategies. These KPIs typically fall into sales, customer, and operational metrics.
Sales KPIs: Measuring Your Bottom Line
Sales KPIs provide essential insights into your revenue generation. This category includes metrics like conversion rate, average order value (AOV), and revenue patterns. Your conversion rate, the percentage of website visitors completing a purchase, shows how well you convert browsers into buyers. A low conversion rate may signal problems with your website’s user experience or checkout process.
AOV tracks the average amount spent per order, highlighting potential upselling or cross-selling opportunities. Analyzing revenue patterns reveals seasonal trends or the impact of marketing campaigns. A sales spike during a specific period could indicate a successful promotion.
Customer KPIs: Understanding Your Audience
Beyond sales, understanding your customers is paramount. Customer acquisition cost (CAC), customer lifetime value (CLV), and customer retention rate are key customer KPIs. CAC measures the cost of acquiring a new customer, while CLV estimates the total revenue generated by a customer over their relationship with your business. Ideally, your CLV should significantly exceed your CAC.
Customer retention rate tracks the percentage of returning customers, indicating customer loyalty and the effectiveness of your retention strategies. High retention rates within the UK, where brand loyalty is important, signal customer satisfaction and a sustainable business model.
Operational KPIs: Optimizing Your Processes
Operational KPIs offer insights into the efficiency of your backend processes. Key metrics include inventory turnover rate, fulfillment speed, and return rate. Inventory turnover rate indicates how quickly your stock sells, reflecting effective stock management and minimizing storage costs. This is particularly relevant in the UK, where warehouse space can be expensive.
Fulfillment speed, the time it takes to process and deliver orders, directly impacts customer satisfaction. This is crucial in the competitive UK retail market, where fast delivery is often a deciding factor. Return rate tracks the percentage of returned orders, highlighting potential issues with product quality or descriptions. Addressing high return rates is crucial for profitability, especially considering reverse logistics costs in the UK.
To better illustrate the core KPIs that UK ecommerce businesses should track, let's look at the following table:
Core UK Ecommerce KPIs by Category
A comprehensive breakdown of essential ecommerce metrics categorized by business function with UK benchmarks
| KPI Category | Key Metrics | UK Industry Benchmarks | Importance Rating |
|---|---|---|---|
| Sales | Conversion Rate | 3.7% (2024) | High |
| Sales | Average Order Value (AOV) | Varies by industry | High |
| Sales | Revenue Patterns | Track monthly/quarterly | High |
| Customer | Customer Acquisition Cost (CAC) | Varies by industry | High |
| Customer | Customer Lifetime Value (CLV) | Varies by industry | High |
| Customer | Customer Retention Rate | Varies by industry | High |
| Operational | Inventory Turnover Rate | Varies by industry | Medium |
| Operational | Fulfillment Speed | 2-3 days is standard | High |
| Operational | Return Rate | Varies by industry, aim for <10% | Medium |
This table summarizes some of the most important metrics for ecommerce businesses in the UK. While benchmarks can vary significantly across industries, focusing on these KPIs provides a strong foundation for growth.
The UK ecommerce market exhibits specific trends within the conversion funnel. Key performance indicators (KPIs) like add-to-cart rate (10.3%), cart abandonment rate (64.2%), and conversion rate (3.7%) as of 2024 highlight potential areas for improvement. Understanding why users abandon their carts allows retailers to refine checkout processes, potentially boosting conversion rates. Find more detailed statistics here: UK Ecommerce Benchmarks
Building a Comprehensive View
Tracking these essential KPIs provides a holistic view of your ecommerce business. This data allows you to identify areas for improvement, optimize your strategies, and ultimately, drive growth within the UK retail market. The value of an ecommerce KPI dashboard lies not just in the data, but in the actions it inspires. Regularly monitoring these metrics allows you to transform data into actionable insights, leading to improved profitability and a stronger competitive edge.
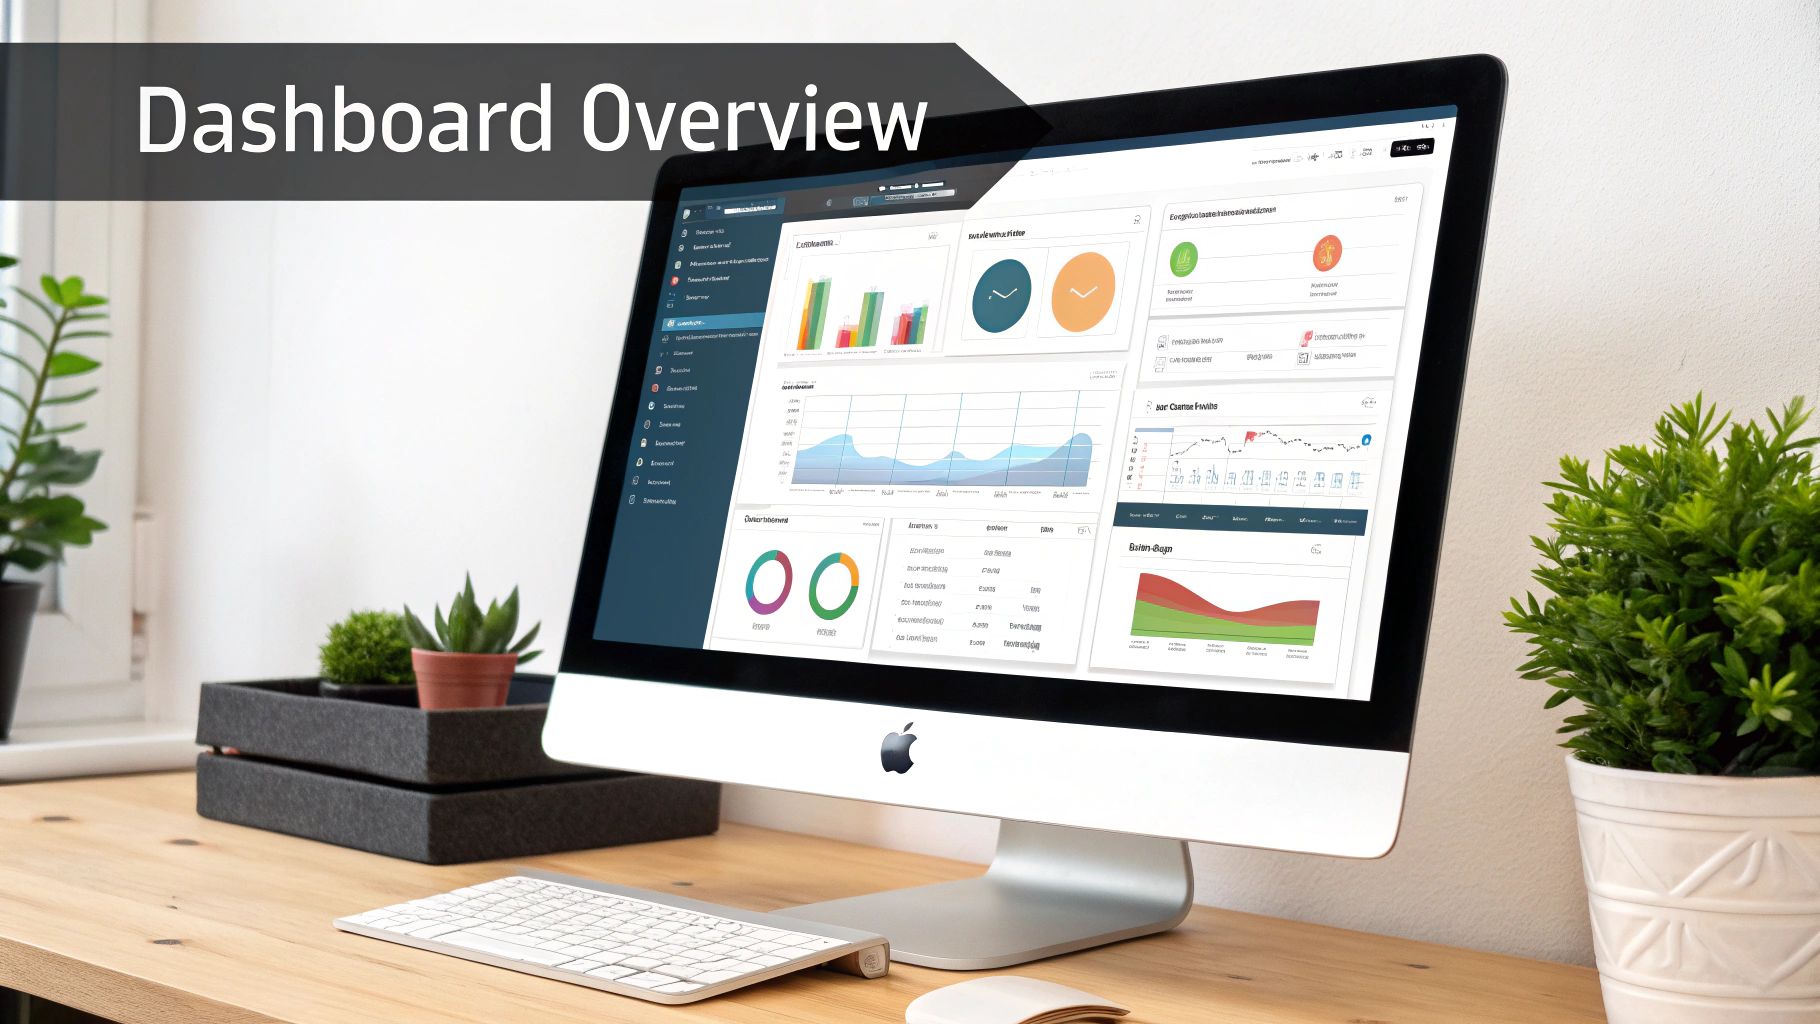
Crafting Your Ecommerce KPI Dashboard for Maximum Impact
Creating an effective ecommerce KPI dashboard isn't just about presenting numbers; it's about designing a strategic tool for decision-making. Think of your dashboard as the cockpit of an airplane. Pilots rely on clear instruments displaying altitude, speed, and fuel levels for safe and efficient navigation. Your dashboard should function similarly, presenting key metrics clearly to enable swift, informed business choices. This is especially crucial in the dynamic UK ecommerce environment.
Visual Hierarchy and Data Visualization
Leading UK retailers recognize the power of visual hierarchy. They structure their dashboards to emphasize the most critical KPIs. A dashboard cluttered with uniformly sized charts and graphs is overwhelming and offers little actionable insight. Instead, prioritize key metrics using larger fonts, bolder colors, and prominent placement to direct attention where it matters most.
Choosing the right visualization for each data set is also essential. A line graph perfectly illustrates trends over time, while a pie chart effectively represents market share. Bar graphs compare product performance, and heat maps identify peak shopping times. Appropriate visualizations enhance clarity and understanding.
Dashboard Structure and Stakeholder Needs
High-performing ecommerce teams tailor their dashboards to different stakeholders. Executive summaries concentrate on high-level metrics like overall revenue and profit margins. Operational dashboards, conversely, delve into granular data like inventory levels, fulfillment speed, and return rates. Different teams require specific data for informed decisions, much like a doctor needs different information than a surgeon.
When setting up your dashboard, consider integrating tools like those offering comprehensive reporting analytics for valuable insights and streamlined data analysis.
Avoiding Common Pitfalls
Information overload is a frequent mistake. Overcrowding a dashboard with too many metrics leads to confusion and inaction. Concentrate on the most vital KPIs and avoid unnecessary clutter. Another pitfall is neglecting mobile optimization. With more ecommerce professionals accessing dashboards on their mobile devices, mobile responsiveness is crucial.
The UK boasts a large and active online shopper base. In 2023, the UK had nearly 60 million e-commerce users, projected to reach 62.1 million by 2025. This highlights the importance of a smooth user experience. Understanding how checkout complexities contribute to cart abandonment can inform strategies to streamline this process. For a deeper dive into these statistics, find more detailed information here.
Action-Oriented Dashboards
Ultimately, your ecommerce KPI dashboard should drive action. It's not about endless analysis, but about identifying trends, tackling problems, and capitalizing on opportunities. A well-designed dashboard should trigger immediate action, not analysis paralysis, turning data into decisions and decisions into results. This proactive approach is essential for success in the competitive British retail market.

Conversion Funnel Mastery Through Your KPI Dashboard
Your ecommerce KPI dashboard is more than a simple reporting tool. It should provide actionable insights into why certain trends are occurring. Leading UK retailers leverage their dashboards to optimize conversions by visualizing the entire customer journey. This allows them to pinpoint areas of friction and understand why British customers abandon their purchases.
This understanding is key to making effective improvements.
Visualizing The Customer Journey: Beyond Basic Conversions
An effective ecommerce KPI dashboard doesn't just track overall conversion rates. It delves deeper into the customer journey, breaking it down into smaller, measurable steps. These micro-conversions, like adding an item to the cart, proceeding to checkout, and finally completing the purchase, paint a much clearer picture of customer behavior.
Think of it as a roadmap detailing not only the final destination but also the important stops along the way. By tracking metrics like add-to-cart rates, cart abandonment rates, and checkout completion rates, you gain a much more granular understanding of the buying process and identify potential roadblocks.
Identifying Drop-Off Points and Diagnosing The "Why"
Visualizing the conversion funnel helps pinpoint the stages where customers are most likely to abandon their purchase. This could be during product discovery, at checkout, or even after the purchase. Identifying these drop-off points is the first step.
The next, and more crucial, step is understanding why these drop-offs occur. Is the checkout process too complex? Are there unexpected fees? Are page load times too slow?
Combining your ecommerce KPI dashboard with user behavior analytics tools like Hotjar can uncover these crucial insights.
Targeted Improvements for Maximum Impact
Once you understand the reasons behind customer drop-offs, you can implement targeted improvements for maximum impact. For example, if high cart abandonment rates are linked to a complex checkout process, simplifying the steps can significantly boost conversions.
Similarly, if customers are leaving during the product discovery phase, improving site search functionality or implementing personalized product recommendations can significantly enhance engagement. These targeted improvements are far more effective than broad, site-wide changes.
Funnel Stage Tactics: From Discovery To Post-Purchase
Each stage of the funnel requires a different optimization strategy. During product discovery, focus on optimizing site search and providing personalized recommendations. During checkout, streamline the process, offer various payment methods, and clearly display shipping costs.
In the post-purchase stage, nurture customer relationships with personalized follow-up emails and loyalty programs.
To illustrate how conversion metrics vary across different retail sectors, let's examine the following table:
To better understand the performance of different retail categories, let's examine the table below:
Conversion Funnel KPIs Comparison Across UK Retail Sectors
Comparative analysis of conversion metrics across different UK ecommerce retail categories
| Retail Category | Add-to-Cart Rate | Cart Abandonment Rate | Conversion Rate | Key Optimisation Opportunities |
|---|---|---|---|---|
| Fashion | 8% | 70% | 2.4% | Size guides, clear return policies |
| Electronics | 12% | 65% | 4.2% | Detailed product information, financing options |
| Groceries | 15% | 55% | 6.75% | Streamlined checkout, subscription options |
While these figures are illustrative, they emphasize the importance of understanding sector-specific trends to inform optimization strategies. For instance, the high cart abandonment rate in fashion highlights the need for clear sizing information and hassle-free returns.
By leveraging your ecommerce KPI dashboard to analyze the entire conversion funnel, you shift from passively monitoring metrics to actively optimizing for conversions. This data-driven approach is paramount for sustainable growth in the competitive UK ecommerce market.
Implementing Dashboard Solutions That Actually Work
Selecting the right ecommerce KPI dashboard for your UK business can be a daunting task. The sheer number of options, from all-in-one platforms to specialized tools, makes finding the perfect fit a challenge. This section offers practical guidance on choosing and implementing dashboard solutions that truly benefit your business.
Evaluating Your Options: From Shopify to Specialized Tools
The ecommerce KPI dashboard market offers a wide variety of solutions. Large-scale platforms like Shopify Analytics and Adobe Commerce provide integrated analytics within their own ecosystems. These are generally suitable for larger businesses already invested in these platforms. However, their cost can be prohibitive for smaller enterprises.
More niche tools like Glew.io and Conversific offer a targeted approach, often focusing on specific needs such as marketing analytics or conversion rate optimization. These options can be more budget-friendly for smaller businesses and often integrate seamlessly with existing platforms. Also consider platforms like Mergoio, specifically designed for UK TikTok Shop sellers, with a focus on detailed sales and profit monitoring.
Practical Considerations: Size, Budget, and Integration
When assessing different ecommerce KPI dashboard solutions, keep your specific business needs in mind. Cost is often a major factor for smaller UK businesses. Tools like Google Analytics provide free, robust analytics, though they may require some technical know-how for effective setup.
Larger enterprises may need more advanced solutions with features like predictive analytics and customizable reporting. Integration with your existing systems, like your CRM or payment gateway, is another key element. Seamless data flow between platforms streamlines your reporting and analysis.
Navigating Implementation Challenges: Real-World Insights
Implementing a new dashboard is rarely a simple process. UK retailers often encounter integration challenges with region-specific payment processors and fulfillment services. Setting realistic timelines for deployment is crucial. Don't expect a complex dashboard to be operational overnight. Allow ample time for setup, testing, and staff training.
Data privacy is another critical factor, especially in the UK, with GDPR regulations. Ensure your chosen dashboard solution is GDPR compliant, protecting customer data while still providing valuable business intelligence.
Integration with UK-Specific Systems
UK businesses should prioritize integration with local payment gateways, such as Stripe and PayPal, and fulfillment services like Royal Mail and Hermes. This integration guarantees your ecommerce KPI dashboard captures accurate data on transactions and delivery performance, providing a complete overview of your UK operations.
By addressing these practical points and anticipating potential challenges, you can implement an ecommerce KPI dashboard that yields meaningful insights and fuels your business growth in the competitive UK retail market. Selecting the right solution, deploying it effectively, and ensuring data compliance empowers you to make well-informed decisions and optimize your operations for sustained success.
Transforming Dashboard Insights Into Strategic Actions
An ecommerce KPI dashboard is only as good as the actions it inspires. A visually appealing dashboard is pointless without translating its data into tangible business decisions. This section explores how to convert the data from your ecommerce KPI dashboard into strategic moves that boost your bottom line in the UK.
Establishing Effective Dashboard Review Rhythms
Just like regularly checking your car's gauges, consistently reviewing your dashboard is crucial for a smooth business journey. Successful retail leaders integrate dashboard reviews into their regular workflow.
Some hold daily meetings to discuss key metrics and address immediate concerns. Others prefer weekly deep dives to analyze trends and plan for the coming week. The key is finding a cadence that works for your business and maintaining it.
Setting Appropriate KPI Targets for the UK Market
A "good" conversion rate or average order value depends on the industry and the specific market. Setting realistic KPI targets, tailored to the UK market, is essential.
This involves researching industry benchmarks, understanding UK consumer behavior, and considering your business's specific context. For example, a 5% conversion rate might be ambitious for a niche retailer, while a large brand might aim for 8% or higher. Appropriate calibration ensures your targets are challenging yet achievable.
Developing Action Plans in Response to Metric Movements
Your ecommerce KPI dashboard shouldn't just highlight changes; it should trigger action plans. A drop in conversion rate might necessitate A/B testing different checkout processes or improving product descriptions. Increased cart abandonment might indicate issues with shipping costs or payment options.
Your dashboard is an early warning system, alerting you to problems and prompting corrective action. This proactive approach is vital in ecommerce.
Communicating Dashboard Insights Across Departments
Data insights are most effective when shared across the organization. Successful ecommerce companies cultivate data transparency, making dashboard insights accessible to everyone from marketing and sales to fulfillment and customer service.
Mergoio, designed for UK TikTok Shop sellers, provides a detailed dashboard focused on sales and profit monitoring. It tracks affiliate spending, cancellation trends, and more, enabling collaborative problem-solving and strategic alignment.
This shared understanding of performance improves decision-making at all levels, ensuring everyone works towards the same goals.
Real-World Examples of Dashboard-Driven Success in the UK
Many British ecommerce businesses have leveraged dashboard insights for significant improvements. One fashion retailer identified high cart abandonment due to unclear sizing information. Adding detailed size guides and customer reviews increased conversions.
Another small business discovered, via its ecommerce KPI dashboard, that a large portion of sales came from mobile devices. Investing in mobile site improvements resulted in increased mobile conversions.
By understanding how to transform dashboard data into strategic actions, UK ecommerce businesses can unlock growth opportunities. A data-driven approach, with consistent monitoring and proactive responses, is essential in today's retail environment. Tools like Mergoio provide granular insights for informed decisions and operational optimization. For more information on powerful tools for TikTok Shop sellers in the UK, visit Mergoio.
The Future of Ecommerce KPI Dashboards
The world of ecommerce is constantly evolving, and so are the ways we measure success. Ecommerce KPI dashboards are no longer static reports reflecting past performance. They are becoming dynamic, predictive tools, anticipating future trends and empowering businesses to make proactive decisions. This is particularly important in the fast-paced UK retail market.
AI and Machine Learning: Predicting the Future of Shopping
Artificial intelligence (AI) and machine learning (ML) are driving this transformation. These technologies analyze large amounts of data to identify patterns and predict future customer behavior. For example, AI can predict trending products, helping businesses optimize stock and marketing campaigns. Machine Learning can identify customers at risk of churning, enabling targeted retention strategies. This predictive capability is key to staying ahead in the UK's competitive online marketplace.
Advanced Customer Segmentation: Micro-Targeted Insights
Traditional customer segmentation often relies on broad demographics. Advanced segmentation uses AI and ML to analyze a wider range of data, including browsing history, purchase patterns, and even social media activity. This creates highly specific customer segments, allowing businesses to tailor their marketing and product offerings. Imagine offering personalized discounts based on predicted purchases. This targeted approach increases conversions and strengthens customer loyalty.
Real-Time Analytics: From Weeks to Minutes
Real-time analytics drastically shortens decision cycles. Traditional reporting often takes weeks or months to collect and analyze data. Real-time ecommerce KPI dashboards provide instant insights into key metrics, allowing businesses to react quickly to market changes. For example, a sudden spike in demand can be identified and addressed immediately, preventing stockouts and lost sales. This responsiveness is vital in the UK's competitive online landscape.
Sentiment Analysis: Capturing the Emotional Dimension
Sentiment analysis uses natural language processing to understand customer emotions towards products, brands, and campaigns. This adds another layer of understanding to traditional metrics. Negative sentiment around a new product, for instance, could prompt a business to revise its marketing or address product concerns. This provides a deeper understanding of the customer experience.
Emerging Trends in UK Ecommerce Dashboards
Forward-thinking UK retailers are incorporating new metrics into their ecommerce KPI dashboards for a competitive edge:
- Sustainability Metrics: Tracking carbon emissions, packaging waste, and ethical sourcing, which are important to environmentally conscious consumers.
- Voice Commerce Indicators: Monitoring voice search queries, conversion rates, and customer interactions via voice assistants as voice search grows.
- Cross-Channel Attribution Models: Understanding how different marketing channels contribute to conversions for optimizing ad spend.
By embracing these trends, businesses position themselves for future success.
Preparing for the Future: A Competitive Advantage
Staying informed about these emerging technologies is crucial for any UK ecommerce business. Adopting these advancements transforms your ecommerce KPI dashboard into a powerful tool for growth. This empowers you to not only react to changes but anticipate and shape your future in the UK's thriving online retail sector. Ready to transform your TikTok Shop business with data-driven insights? Mergoio offers a sales and profit tracking dashboard for UK TikTok Shop sellers. Gain real-time analytics, predict trends, and optimize operations. Start your free trial: https://mergoio.com
Leave a Reply